Hispanic or Latino vs Malaysian Births to Unmarried Women
COMPARE
Hispanic or Latino
Malaysian
Births to Unmarried Women
Births to Unmarried Women Comparison
Hispanics or Latinos
Malaysians
37.8%
BIRTHS TO UNMARRIED WOMEN
0.0/ 100
METRIC RATING
290th/ 347
METRIC RANK
33.9%
BIRTHS TO UNMARRIED WOMEN
5.0/ 100
METRIC RATING
221st/ 347
METRIC RANK
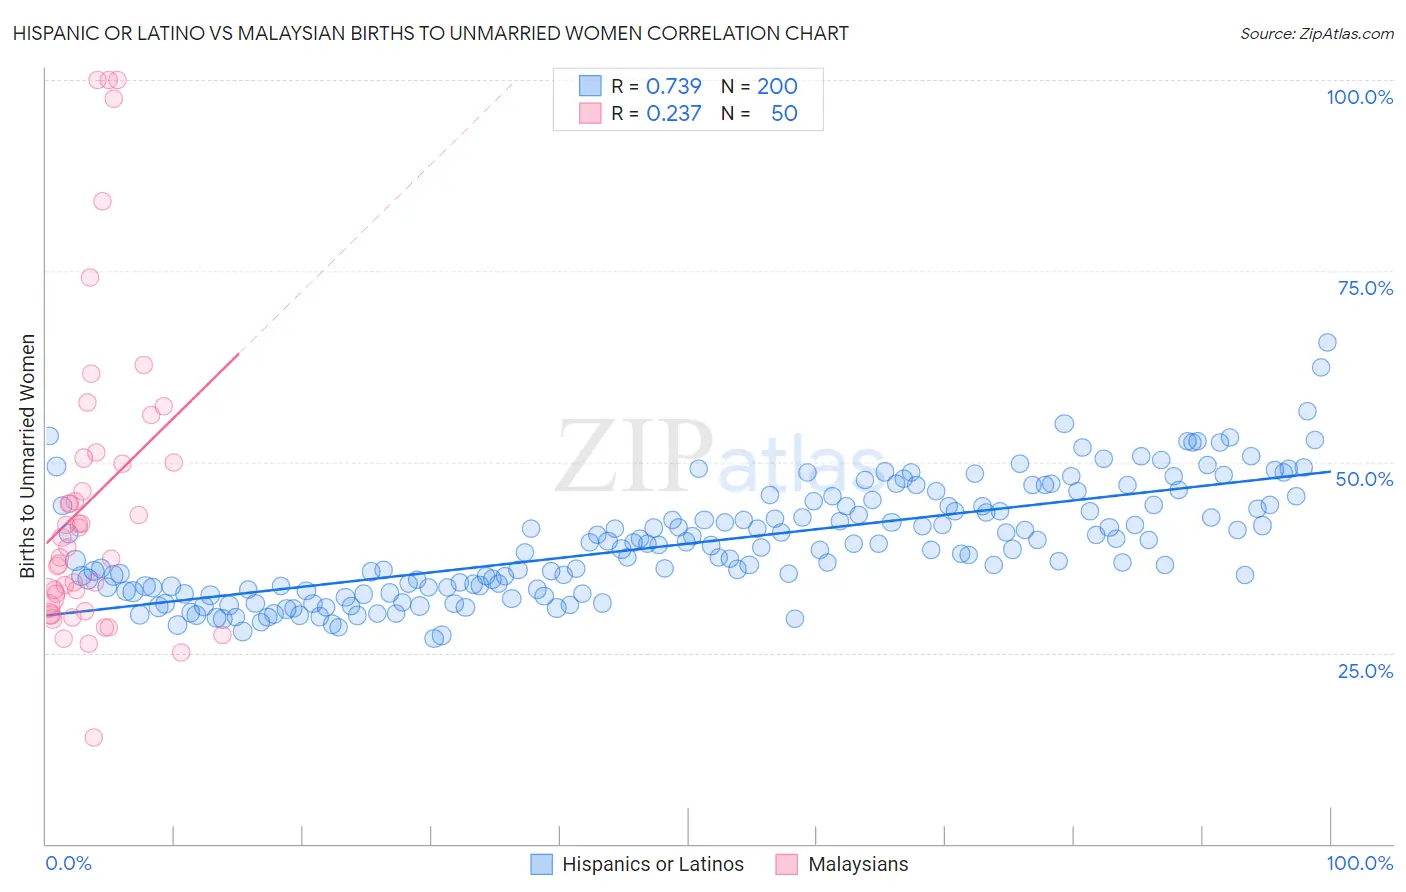
Hispanic or Latino vs Malaysian Births to Unmarried Women Correlation Chart
The statistical analysis conducted on geographies consisting of 511,497,668 people shows a strong positive correlation between the proportion of Hispanics or Latinos and percentage of births to unmarried women in the United States with a correlation coefficient (R) of 0.739 and weighted average of 37.8%. Similarly, the statistical analysis conducted on geographies consisting of 219,699,687 people shows a weak positive correlation between the proportion of Malaysians and percentage of births to unmarried women in the United States with a correlation coefficient (R) of 0.237 and weighted average of 33.9%, a difference of 11.5%.
Births to Unmarried Women Correlation Summary
| Measurement | Hispanic or Latino | Malaysian |
| Minimum | 26.9% | 13.9% |
| Maximum | 65.6% | 100.0% |
| Range | 38.8% | 86.1% |
| Mean | 39.3% | 45.2% |
| Median | 38.7% | 39.4% |
| Interquartile 25% (IQ1) | 33.3% | 31.1% |
| Interquartile 75% (IQ3) | 44.3% | 50.5% |
| Interquartile Range (IQR) | 11.0% | 19.4% |
| Standard Deviation (Sample) | 7.4% | 20.7% |
| Standard Deviation (Population) | 7.4% | 20.4% |
Similar Demographics by Births to Unmarried Women
Demographics Similar to Hispanics or Latinos by Births to Unmarried Women
In terms of births to unmarried women, the demographic groups most similar to Hispanics or Latinos are Alaskan Athabascan (37.7%, a difference of 0.14%), Seminole (37.9%, a difference of 0.34%), Immigrants from Liberia (37.6%, a difference of 0.37%), Blackfeet (37.9%, a difference of 0.39%), and Creek (37.6%, a difference of 0.54%).
| Demographics | Rating | Rank | Births to Unmarried Women |
| Spanish American Indians | 0.0 /100 | #283 | Tragic 37.4% |
| Immigrants | Central America | 0.0 /100 | #284 | Tragic 37.4% |
| Immigrants | Mexico | 0.0 /100 | #285 | Tragic 37.5% |
| Immigrants | Guatemala | 0.0 /100 | #286 | Tragic 37.5% |
| Creek | 0.0 /100 | #287 | Tragic 37.6% |
| Immigrants | Liberia | 0.0 /100 | #288 | Tragic 37.6% |
| Alaskan Athabascans | 0.0 /100 | #289 | Tragic 37.7% |
| Hispanics or Latinos | 0.0 /100 | #290 | Tragic 37.8% |
| Seminole | 0.0 /100 | #291 | Tragic 37.9% |
| Blackfeet | 0.0 /100 | #292 | Tragic 37.9% |
| Immigrants | Nicaragua | 0.0 /100 | #293 | Tragic 38.0% |
| British West Indians | 0.0 /100 | #294 | Tragic 38.0% |
| Iroquois | 0.0 /100 | #295 | Tragic 38.2% |
| Alaska Natives | 0.0 /100 | #296 | Tragic 38.3% |
| Dutch West Indians | 0.0 /100 | #297 | Tragic 38.4% |
Demographics Similar to Malaysians by Births to Unmarried Women
In terms of births to unmarried women, the demographic groups most similar to Malaysians are Immigrants from Uruguay (33.9%, a difference of 0.060%), Portuguese (33.8%, a difference of 0.17%), Alsatian (33.8%, a difference of 0.19%), Pennsylvania German (34.0%, a difference of 0.35%), and Immigrants from Laos (34.0%, a difference of 0.36%).
| Demographics | Rating | Rank | Births to Unmarried Women |
| Slovaks | 9.3 /100 | #214 | Tragic 33.4% |
| French | 8.7 /100 | #215 | Tragic 33.4% |
| Nepalese | 7.8 /100 | #216 | Tragic 33.5% |
| Spaniards | 7.0 /100 | #217 | Tragic 33.6% |
| Immigrants | Ecuador | 5.9 /100 | #218 | Tragic 33.7% |
| Alsatians | 5.4 /100 | #219 | Tragic 33.8% |
| Portuguese | 5.4 /100 | #220 | Tragic 33.8% |
| Malaysians | 5.0 /100 | #221 | Tragic 33.9% |
| Immigrants | Uruguay | 4.8 /100 | #222 | Tragic 33.9% |
| Pennsylvania Germans | 4.3 /100 | #223 | Tragic 34.0% |
| Immigrants | Laos | 4.3 /100 | #224 | Tragic 34.0% |
| Spanish | 4.0 /100 | #225 | Tragic 34.1% |
| Delaware | 3.3 /100 | #226 | Tragic 34.2% |
| Immigrants | Panama | 3.3 /100 | #227 | Tragic 34.2% |
| Panamanians | 3.3 /100 | #228 | Tragic 34.2% |