Hispanic or Latino vs Irish Divorced or Separated
COMPARE
Hispanic or Latino
Irish
Divorced or Separated
Divorced or Separated Comparison
Hispanics or Latinos
Irish
12.5%
DIVORCED OR SEPARATED
2.0/ 100
METRIC RATING
245th/ 347
METRIC RANK
12.5%
DIVORCED OR SEPARATED
1.3/ 100
METRIC RATING
250th/ 347
METRIC RANK
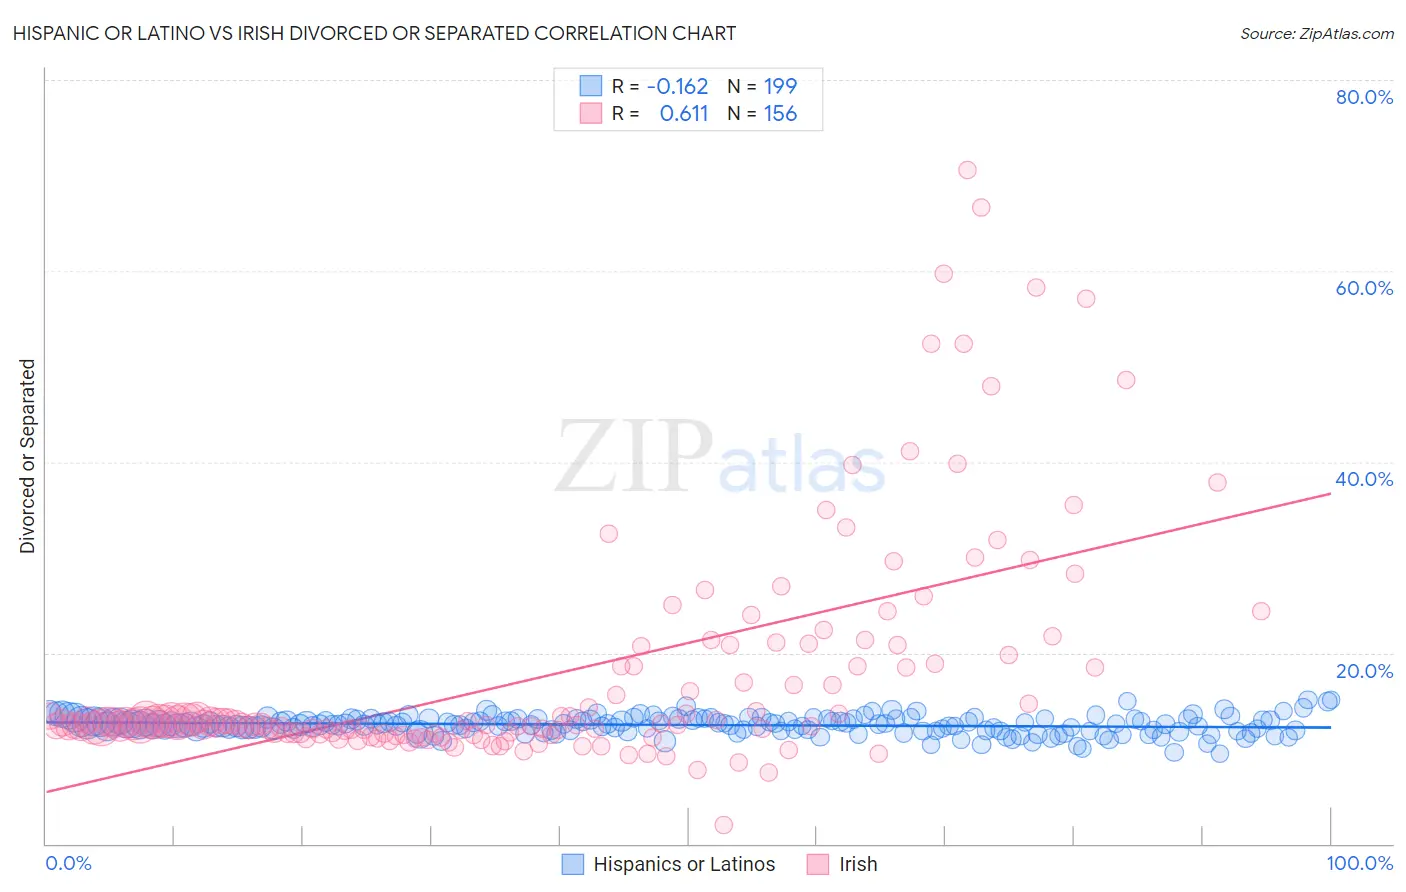
Hispanic or Latino vs Irish Divorced or Separated Correlation Chart
The statistical analysis conducted on geographies consisting of 575,306,240 people shows a poor negative correlation between the proportion of Hispanics or Latinos and percentage of population currently divorced or separated in the United States with a correlation coefficient (R) of -0.162 and weighted average of 12.5%. Similarly, the statistical analysis conducted on geographies consisting of 580,050,649 people shows a significant positive correlation between the proportion of Irish and percentage of population currently divorced or separated in the United States with a correlation coefficient (R) of 0.611 and weighted average of 12.5%, a difference of 0.36%.
Divorced or Separated Correlation Summary
| Measurement | Hispanic or Latino | Irish |
| Minimum | 9.5% | 2.0% |
| Maximum | 15.1% | 70.6% |
| Range | 5.6% | 68.7% |
| Mean | 12.4% | 17.8% |
| Median | 12.5% | 12.7% |
| Interquartile 25% (IQ1) | 11.9% | 11.6% |
| Interquartile 75% (IQ3) | 13.0% | 19.3% |
| Interquartile Range (IQR) | 1.1% | 7.7% |
| Standard Deviation (Sample) | 0.94% | 12.1% |
| Standard Deviation (Population) | 0.93% | 12.1% |
Demographics Similar to Hispanics or Latinos and Irish by Divorced or Separated
In terms of divorced or separated, the demographic groups most similar to Hispanics or Latinos are Immigrants from West Indies (12.5%, a difference of 0.020%), German (12.5%, a difference of 0.050%), Nepalese (12.5%, a difference of 0.080%), Finnish (12.5%, a difference of 0.090%), and Alaska Native (12.4%, a difference of 0.22%). Similarly, the demographic groups most similar to Irish are Aleut (12.5%, a difference of 0.0%), Finnish (12.5%, a difference of 0.27%), Nepalese (12.5%, a difference of 0.29%), German (12.5%, a difference of 0.31%), and Liberian (12.6%, a difference of 0.33%).
| Demographics | Rating | Rank | Divorced or Separated |
| Immigrants | Laos | 4.2 /100 | #237 | Tragic 12.4% |
| Sudanese | 4.0 /100 | #238 | Tragic 12.4% |
| Immigrants | Germany | 4.0 /100 | #239 | Tragic 12.4% |
| British West Indians | 3.7 /100 | #240 | Tragic 12.4% |
| Uruguayans | 3.4 /100 | #241 | Tragic 12.4% |
| Dutch | 3.1 /100 | #242 | Tragic 12.4% |
| Immigrants | Latin America | 2.8 /100 | #243 | Tragic 12.4% |
| Alaska Natives | 2.5 /100 | #244 | Tragic 12.4% |
| Hispanics or Latinos | 2.0 /100 | #245 | Tragic 12.5% |
| Immigrants | West Indies | 1.9 /100 | #246 | Tragic 12.5% |
| Germans | 1.8 /100 | #247 | Tragic 12.5% |
| Nepalese | 1.8 /100 | #248 | Tragic 12.5% |
| Finns | 1.8 /100 | #249 | Tragic 12.5% |
| Irish | 1.3 /100 | #250 | Tragic 12.5% |
| Aleuts | 1.3 /100 | #251 | Tragic 12.5% |
| Liberians | 0.9 /100 | #252 | Tragic 12.6% |
| Somalis | 0.9 /100 | #253 | Tragic 12.6% |
| Senegalese | 0.8 /100 | #254 | Tragic 12.6% |
| Welsh | 0.7 /100 | #255 | Tragic 12.6% |
| Immigrants | Colombia | 0.6 /100 | #256 | Tragic 12.6% |
| Immigrants | Somalia | 0.6 /100 | #257 | Tragic 12.6% |