Immigrants from India vs Irish Divorced or Separated
COMPARE
Immigrants from India
Irish
Divorced or Separated
Divorced or Separated Comparison
Immigrants from India
Irish
10.1%
DIVORCED OR SEPARATED
100.0/ 100
METRIC RATING
5th/ 347
METRIC RANK
12.5%
DIVORCED OR SEPARATED
1.3/ 100
METRIC RATING
250th/ 347
METRIC RANK
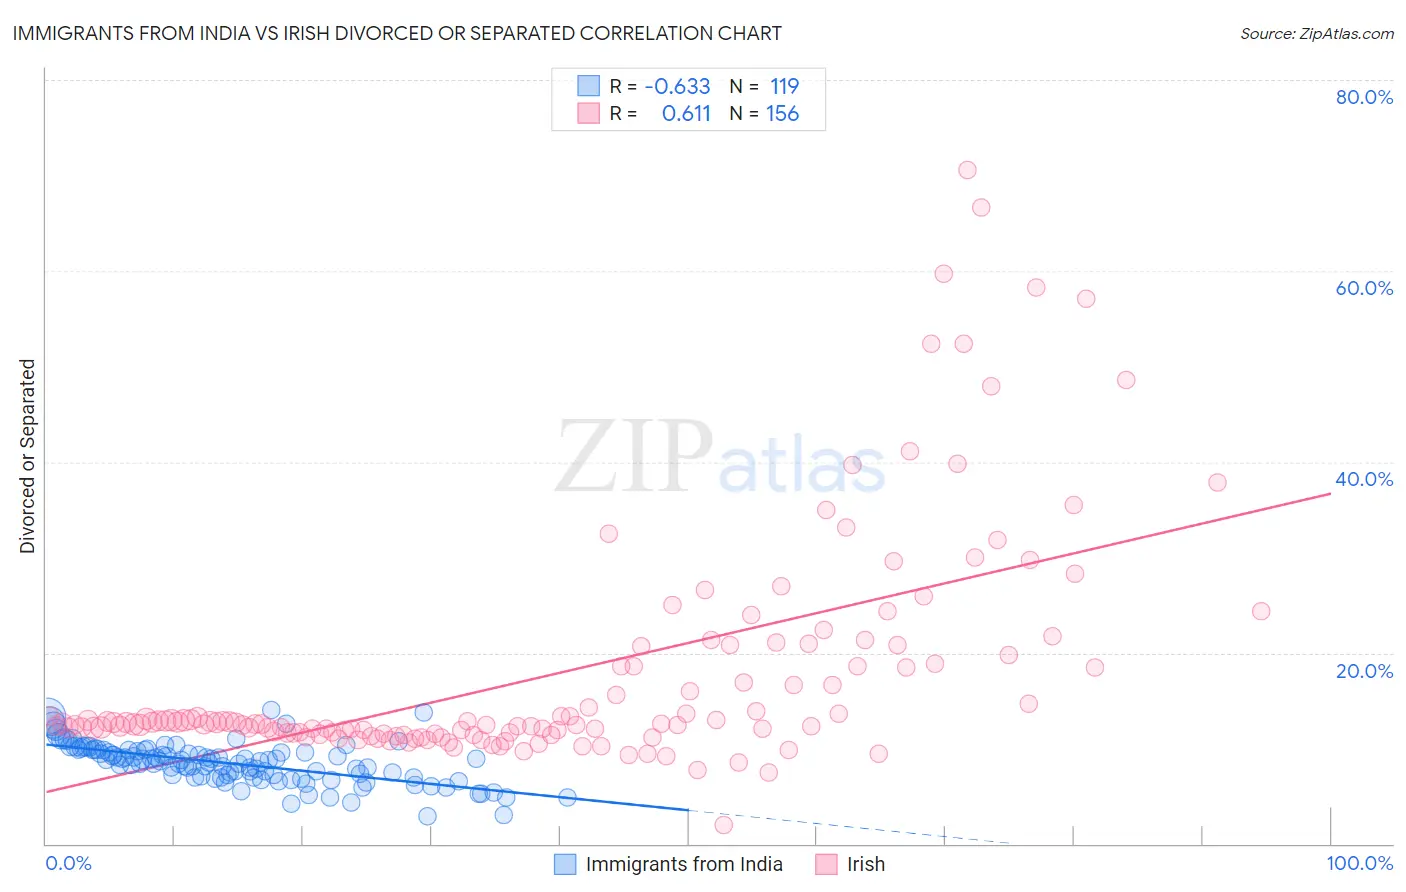
Immigrants from India vs Irish Divorced or Separated Correlation Chart
The statistical analysis conducted on geographies consisting of 433,839,152 people shows a significant negative correlation between the proportion of Immigrants from India and percentage of population currently divorced or separated in the United States with a correlation coefficient (R) of -0.633 and weighted average of 10.1%. Similarly, the statistical analysis conducted on geographies consisting of 580,050,649 people shows a significant positive correlation between the proportion of Irish and percentage of population currently divorced or separated in the United States with a correlation coefficient (R) of 0.611 and weighted average of 12.5%, a difference of 24.3%.
Divorced or Separated Correlation Summary
| Measurement | Immigrants from India | Irish |
| Minimum | 2.9% | 2.0% |
| Maximum | 14.0% | 70.6% |
| Range | 11.1% | 68.7% |
| Mean | 8.4% | 17.8% |
| Median | 8.7% | 12.7% |
| Interquartile 25% (IQ1) | 7.0% | 11.6% |
| Interquartile 75% (IQ3) | 9.8% | 19.3% |
| Interquartile Range (IQR) | 2.8% | 7.7% |
| Standard Deviation (Sample) | 2.1% | 12.1% |
| Standard Deviation (Population) | 2.1% | 12.1% |
Similar Demographics by Divorced or Separated
Demographics Similar to Immigrants from India by Divorced or Separated
In terms of divorced or separated, the demographic groups most similar to Immigrants from India are Immigrants from China (10.0%, a difference of 0.23%), Immigrants from Hong Kong (10.0%, a difference of 0.96%), Indian (Asian) (10.2%, a difference of 1.3%), Thai (10.2%, a difference of 1.4%), and Filipino (9.9%, a difference of 1.5%).
| Demographics | Rating | Rank | Divorced or Separated |
| Immigrants | Taiwan | 100.0 /100 | #1 | Exceptional 9.8% |
| Filipinos | 100.0 /100 | #2 | Exceptional 9.9% |
| Immigrants | Hong Kong | 100.0 /100 | #3 | Exceptional 10.0% |
| Immigrants | China | 100.0 /100 | #4 | Exceptional 10.0% |
| Immigrants | India | 100.0 /100 | #5 | Exceptional 10.1% |
| Indians (Asian) | 100.0 /100 | #6 | Exceptional 10.2% |
| Thais | 100.0 /100 | #7 | Exceptional 10.2% |
| Immigrants | Eastern Asia | 100.0 /100 | #8 | Exceptional 10.2% |
| Yup'ik | 100.0 /100 | #9 | Exceptional 10.3% |
| Immigrants | Singapore | 100.0 /100 | #10 | Exceptional 10.3% |
| Immigrants | South Central Asia | 100.0 /100 | #11 | Exceptional 10.4% |
| Okinawans | 100.0 /100 | #12 | Exceptional 10.5% |
| Cypriots | 100.0 /100 | #13 | Exceptional 10.5% |
| Assyrians/Chaldeans/Syriacs | 100.0 /100 | #14 | Exceptional 10.6% |
| Immigrants | Armenia | 100.0 /100 | #15 | Exceptional 10.6% |
Demographics Similar to Irish by Divorced or Separated
In terms of divorced or separated, the demographic groups most similar to Irish are Aleut (12.5%, a difference of 0.0%), Finnish (12.5%, a difference of 0.27%), Nepalese (12.5%, a difference of 0.29%), German (12.5%, a difference of 0.31%), and Liberian (12.6%, a difference of 0.33%).
| Demographics | Rating | Rank | Divorced or Separated |
| Immigrants | Latin America | 2.8 /100 | #243 | Tragic 12.4% |
| Alaska Natives | 2.5 /100 | #244 | Tragic 12.4% |
| Hispanics or Latinos | 2.0 /100 | #245 | Tragic 12.5% |
| Immigrants | West Indies | 1.9 /100 | #246 | Tragic 12.5% |
| Germans | 1.8 /100 | #247 | Tragic 12.5% |
| Nepalese | 1.8 /100 | #248 | Tragic 12.5% |
| Finns | 1.8 /100 | #249 | Tragic 12.5% |
| Irish | 1.3 /100 | #250 | Tragic 12.5% |
| Aleuts | 1.3 /100 | #251 | Tragic 12.5% |
| Liberians | 0.9 /100 | #252 | Tragic 12.6% |
| Somalis | 0.9 /100 | #253 | Tragic 12.6% |
| Senegalese | 0.8 /100 | #254 | Tragic 12.6% |
| Welsh | 0.7 /100 | #255 | Tragic 12.6% |
| Immigrants | Colombia | 0.6 /100 | #256 | Tragic 12.6% |
| Immigrants | Somalia | 0.6 /100 | #257 | Tragic 12.6% |