Brazilian vs Irish Divorced or Separated
COMPARE
Brazilian
Irish
Divorced or Separated
Divorced or Separated Comparison
Brazilians
Irish
12.1%
DIVORCED OR SEPARATED
47.7/ 100
METRIC RATING
177th/ 347
METRIC RANK
12.5%
DIVORCED OR SEPARATED
1.3/ 100
METRIC RATING
250th/ 347
METRIC RANK
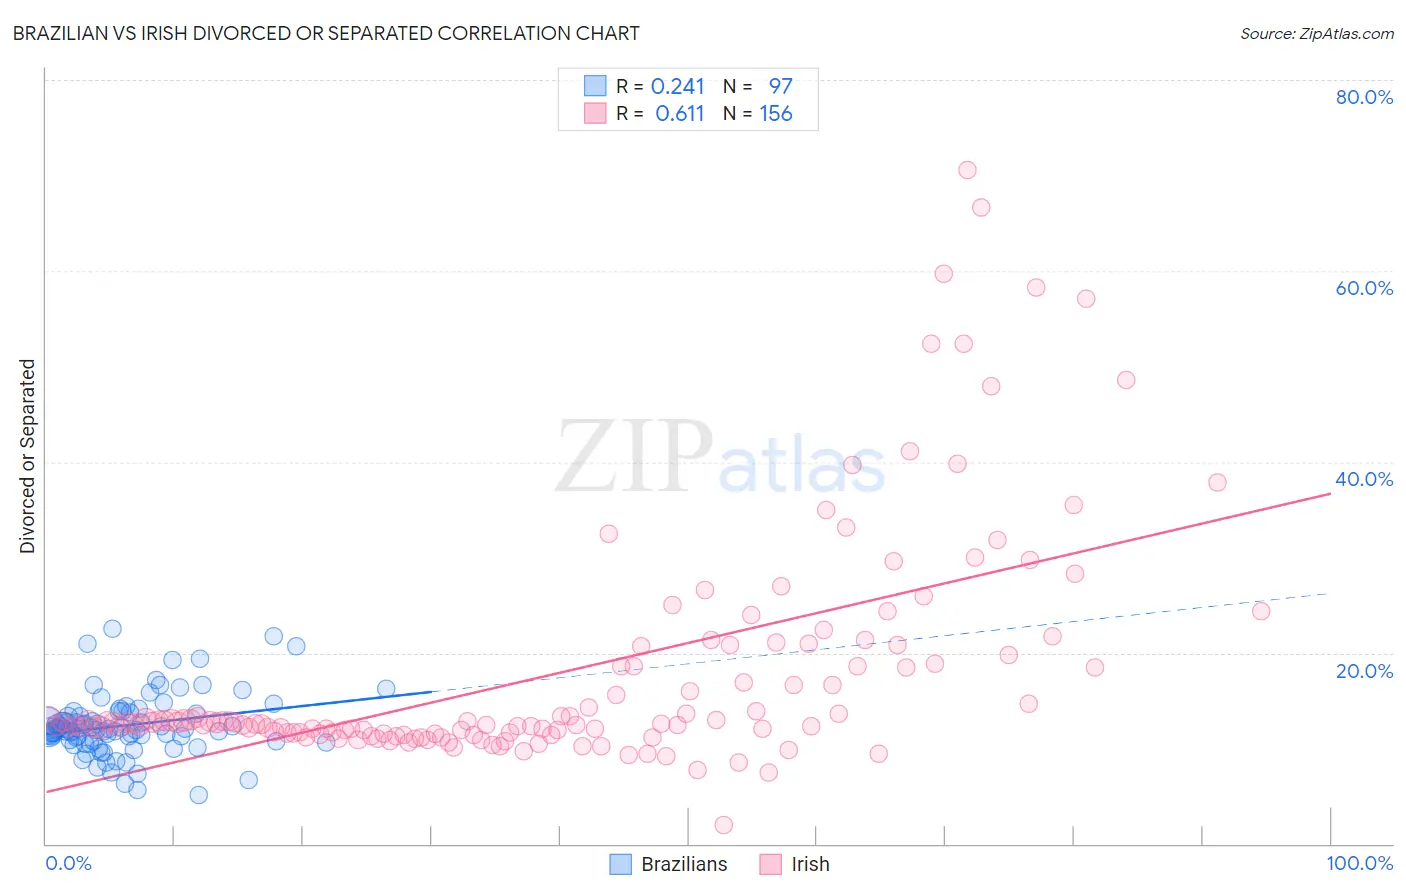
Brazilian vs Irish Divorced or Separated Correlation Chart
The statistical analysis conducted on geographies consisting of 323,792,537 people shows a weak positive correlation between the proportion of Brazilians and percentage of population currently divorced or separated in the United States with a correlation coefficient (R) of 0.241 and weighted average of 12.1%. Similarly, the statistical analysis conducted on geographies consisting of 580,050,649 people shows a significant positive correlation between the proportion of Irish and percentage of population currently divorced or separated in the United States with a correlation coefficient (R) of 0.611 and weighted average of 12.5%, a difference of 3.7%.
Divorced or Separated Correlation Summary
| Measurement | Brazilian | Irish |
| Minimum | 5.1% | 2.0% |
| Maximum | 22.5% | 70.6% |
| Range | 17.4% | 68.7% |
| Mean | 12.4% | 17.8% |
| Median | 12.1% | 12.7% |
| Interquartile 25% (IQ1) | 10.8% | 11.6% |
| Interquartile 75% (IQ3) | 13.6% | 19.3% |
| Interquartile Range (IQR) | 2.8% | 7.7% |
| Standard Deviation (Sample) | 3.2% | 12.1% |
| Standard Deviation (Population) | 3.2% | 12.1% |
Similar Demographics by Divorced or Separated
Demographics Similar to Brazilians by Divorced or Separated
In terms of divorced or separated, the demographic groups most similar to Brazilians are Pennsylvania German (12.1%, a difference of 0.040%), Ghanaian (12.1%, a difference of 0.060%), Hawaiian (12.1%, a difference of 0.080%), Immigrants from Sierra Leone (12.1%, a difference of 0.080%), and Immigrants from Western Europe (12.1%, a difference of 0.080%).
| Demographics | Rating | Rank | Divorced or Separated |
| Mexican American Indians | 55.8 /100 | #170 | Average 12.0% |
| Costa Ricans | 53.3 /100 | #171 | Average 12.0% |
| Immigrants | Mexico | 53.2 /100 | #172 | Average 12.0% |
| Immigrants | Moldova | 50.4 /100 | #173 | Average 12.1% |
| Hawaiians | 50.0 /100 | #174 | Average 12.1% |
| Immigrants | Sierra Leone | 50.0 /100 | #175 | Average 12.1% |
| Pennsylvania Germans | 48.9 /100 | #176 | Average 12.1% |
| Brazilians | 47.7 /100 | #177 | Average 12.1% |
| Ghanaians | 45.9 /100 | #178 | Average 12.1% |
| Immigrants | Western Europe | 45.6 /100 | #179 | Average 12.1% |
| Barbadians | 45.0 /100 | #180 | Average 12.1% |
| Immigrants | Canada | 44.0 /100 | #181 | Average 12.1% |
| Immigrants | Ethiopia | 43.1 /100 | #182 | Average 12.1% |
| Immigrants | Central America | 42.9 /100 | #183 | Average 12.1% |
| Immigrants | North America | 41.1 /100 | #184 | Average 12.1% |
Demographics Similar to Irish by Divorced or Separated
In terms of divorced or separated, the demographic groups most similar to Irish are Aleut (12.5%, a difference of 0.0%), Finnish (12.5%, a difference of 0.27%), Nepalese (12.5%, a difference of 0.29%), German (12.5%, a difference of 0.31%), and Liberian (12.6%, a difference of 0.33%).
| Demographics | Rating | Rank | Divorced or Separated |
| Immigrants | Latin America | 2.8 /100 | #243 | Tragic 12.4% |
| Alaska Natives | 2.5 /100 | #244 | Tragic 12.4% |
| Hispanics or Latinos | 2.0 /100 | #245 | Tragic 12.5% |
| Immigrants | West Indies | 1.9 /100 | #246 | Tragic 12.5% |
| Germans | 1.8 /100 | #247 | Tragic 12.5% |
| Nepalese | 1.8 /100 | #248 | Tragic 12.5% |
| Finns | 1.8 /100 | #249 | Tragic 12.5% |
| Irish | 1.3 /100 | #250 | Tragic 12.5% |
| Aleuts | 1.3 /100 | #251 | Tragic 12.5% |
| Liberians | 0.9 /100 | #252 | Tragic 12.6% |
| Somalis | 0.9 /100 | #253 | Tragic 12.6% |
| Senegalese | 0.8 /100 | #254 | Tragic 12.6% |
| Welsh | 0.7 /100 | #255 | Tragic 12.6% |
| Immigrants | Colombia | 0.6 /100 | #256 | Tragic 12.6% |
| Immigrants | Somalia | 0.6 /100 | #257 | Tragic 12.6% |