Hispanic or Latino vs Immigrants from Armenia Divorced or Separated
COMPARE
Hispanic or Latino
Immigrants from Armenia
Divorced or Separated
Divorced or Separated Comparison
Hispanics or Latinos
Immigrants from Armenia
12.5%
DIVORCED OR SEPARATED
2.0/ 100
METRIC RATING
245th/ 347
METRIC RANK
10.6%
DIVORCED OR SEPARATED
100.0/ 100
METRIC RATING
15th/ 347
METRIC RANK
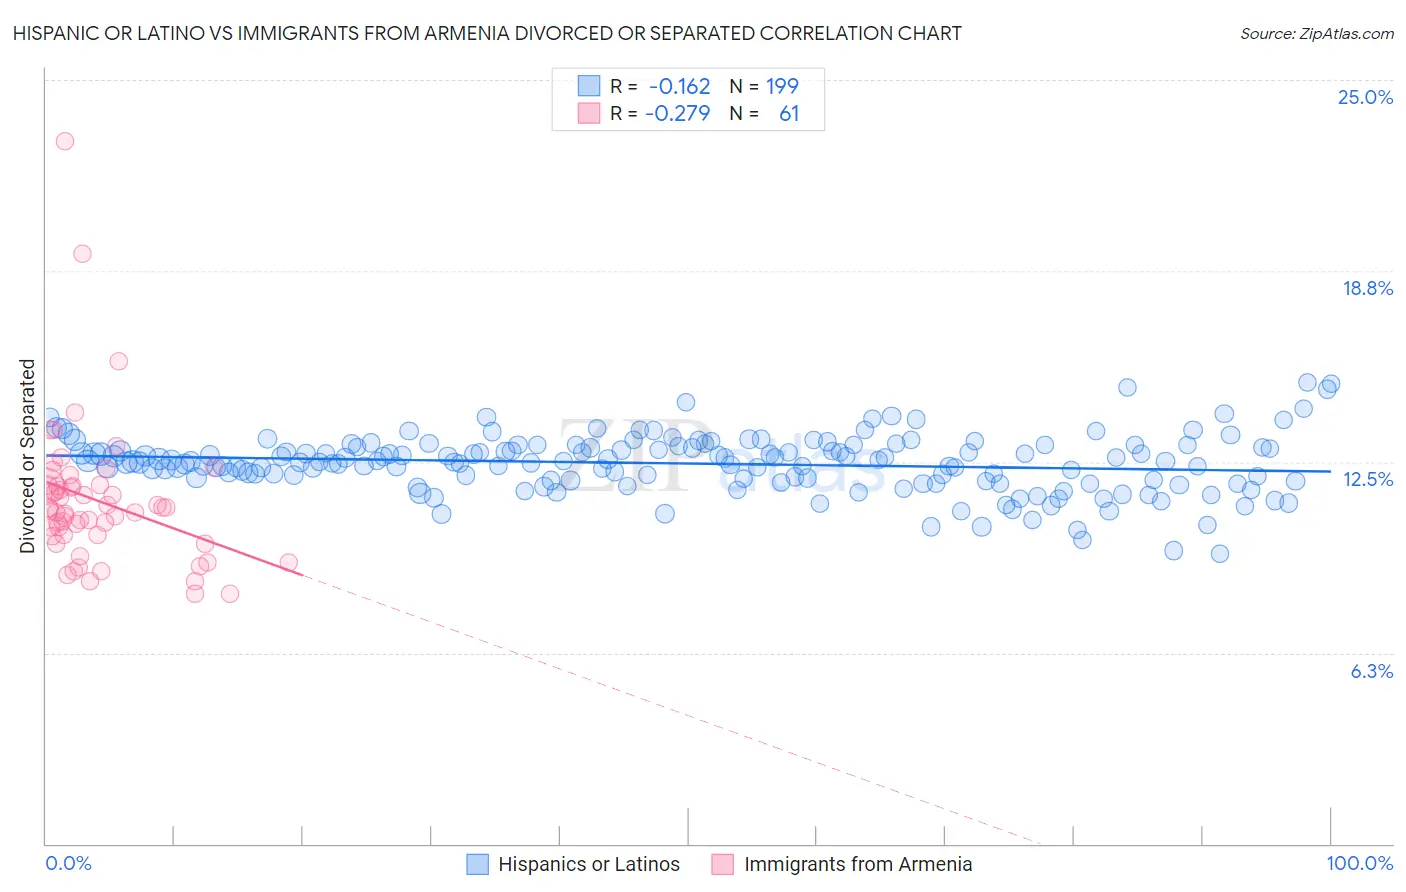
Hispanic or Latino vs Immigrants from Armenia Divorced or Separated Correlation Chart
The statistical analysis conducted on geographies consisting of 575,306,240 people shows a poor negative correlation between the proportion of Hispanics or Latinos and percentage of population currently divorced or separated in the United States with a correlation coefficient (R) of -0.162 and weighted average of 12.5%. Similarly, the statistical analysis conducted on geographies consisting of 97,716,908 people shows a weak negative correlation between the proportion of Immigrants from Armenia and percentage of population currently divorced or separated in the United States with a correlation coefficient (R) of -0.279 and weighted average of 10.6%, a difference of 17.9%.
Divorced or Separated Correlation Summary
| Measurement | Hispanic or Latino | Immigrants from Armenia |
| Minimum | 9.5% | 8.2% |
| Maximum | 15.1% | 23.0% |
| Range | 5.6% | 14.8% |
| Mean | 12.4% | 11.2% |
| Median | 12.5% | 11.0% |
| Interquartile 25% (IQ1) | 11.9% | 10.1% |
| Interquartile 75% (IQ3) | 13.0% | 11.7% |
| Interquartile Range (IQR) | 1.1% | 1.6% |
| Standard Deviation (Sample) | 0.94% | 2.4% |
| Standard Deviation (Population) | 0.93% | 2.4% |
Similar Demographics by Divorced or Separated
Demographics Similar to Hispanics or Latinos by Divorced or Separated
In terms of divorced or separated, the demographic groups most similar to Hispanics or Latinos are Immigrants from West Indies (12.5%, a difference of 0.020%), German (12.5%, a difference of 0.050%), Nepalese (12.5%, a difference of 0.080%), Finnish (12.5%, a difference of 0.090%), and Alaska Native (12.4%, a difference of 0.22%).
| Demographics | Rating | Rank | Divorced or Separated |
| Sudanese | 4.0 /100 | #238 | Tragic 12.4% |
| Immigrants | Germany | 4.0 /100 | #239 | Tragic 12.4% |
| British West Indians | 3.7 /100 | #240 | Tragic 12.4% |
| Uruguayans | 3.4 /100 | #241 | Tragic 12.4% |
| Dutch | 3.1 /100 | #242 | Tragic 12.4% |
| Immigrants | Latin America | 2.8 /100 | #243 | Tragic 12.4% |
| Alaska Natives | 2.5 /100 | #244 | Tragic 12.4% |
| Hispanics or Latinos | 2.0 /100 | #245 | Tragic 12.5% |
| Immigrants | West Indies | 1.9 /100 | #246 | Tragic 12.5% |
| Germans | 1.8 /100 | #247 | Tragic 12.5% |
| Nepalese | 1.8 /100 | #248 | Tragic 12.5% |
| Finns | 1.8 /100 | #249 | Tragic 12.5% |
| Irish | 1.3 /100 | #250 | Tragic 12.5% |
| Aleuts | 1.3 /100 | #251 | Tragic 12.5% |
| Liberians | 0.9 /100 | #252 | Tragic 12.6% |
Demographics Similar to Immigrants from Armenia by Divorced or Separated
In terms of divorced or separated, the demographic groups most similar to Immigrants from Armenia are Assyrian/Chaldean/Syriac (10.6%, a difference of 0.070%), Immigrants from Korea (10.6%, a difference of 0.44%), Immigrants from Israel (10.6%, a difference of 0.55%), Immigrants from Iran (10.6%, a difference of 0.63%), and Asian (10.6%, a difference of 0.64%).
| Demographics | Rating | Rank | Divorced or Separated |
| Immigrants | Eastern Asia | 100.0 /100 | #8 | Exceptional 10.2% |
| Yup'ik | 100.0 /100 | #9 | Exceptional 10.3% |
| Immigrants | Singapore | 100.0 /100 | #10 | Exceptional 10.3% |
| Immigrants | South Central Asia | 100.0 /100 | #11 | Exceptional 10.4% |
| Okinawans | 100.0 /100 | #12 | Exceptional 10.5% |
| Cypriots | 100.0 /100 | #13 | Exceptional 10.5% |
| Assyrians/Chaldeans/Syriacs | 100.0 /100 | #14 | Exceptional 10.6% |
| Immigrants | Armenia | 100.0 /100 | #15 | Exceptional 10.6% |
| Immigrants | Korea | 100.0 /100 | #16 | Exceptional 10.6% |
| Immigrants | Israel | 100.0 /100 | #17 | Exceptional 10.6% |
| Immigrants | Iran | 100.0 /100 | #18 | Exceptional 10.6% |
| Asians | 100.0 /100 | #19 | Exceptional 10.6% |
| Burmese | 100.0 /100 | #20 | Exceptional 10.7% |
| Immigrants | Asia | 100.0 /100 | #21 | Exceptional 10.7% |
| Vietnamese | 100.0 /100 | #22 | Exceptional 10.8% |