Immigrants from Fiji vs Irish Divorced or Separated
COMPARE
Immigrants from Fiji
Irish
Divorced or Separated
Divorced or Separated Comparison
Immigrants from Fiji
Irish
11.6%
DIVORCED OR SEPARATED
98.9/ 100
METRIC RATING
94th/ 347
METRIC RANK
12.5%
DIVORCED OR SEPARATED
1.3/ 100
METRIC RATING
250th/ 347
METRIC RANK
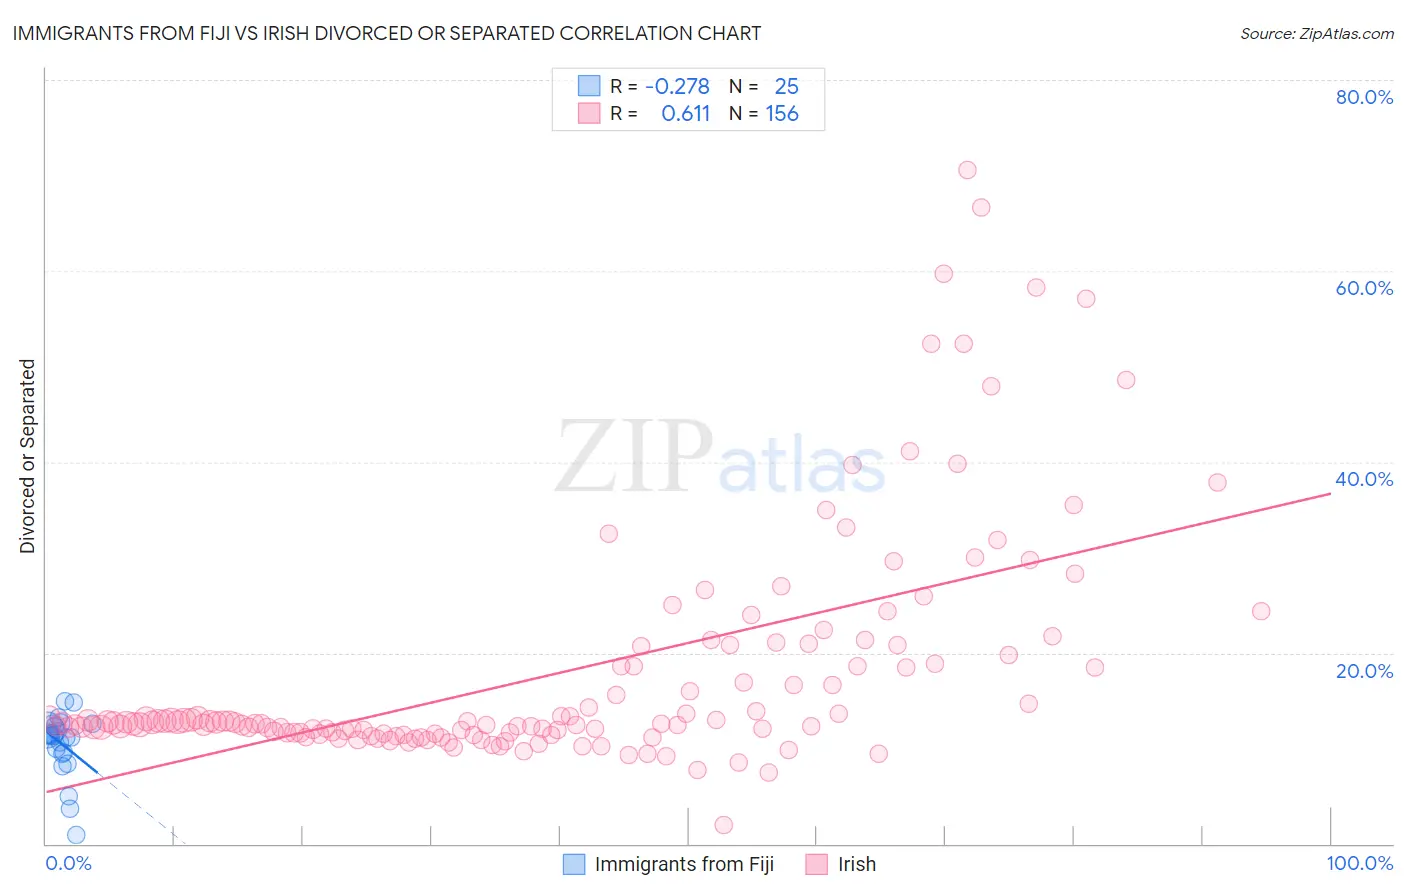
Immigrants from Fiji vs Irish Divorced or Separated Correlation Chart
The statistical analysis conducted on geographies consisting of 93,755,407 people shows a weak negative correlation between the proportion of Immigrants from Fiji and percentage of population currently divorced or separated in the United States with a correlation coefficient (R) of -0.278 and weighted average of 11.6%. Similarly, the statistical analysis conducted on geographies consisting of 580,050,649 people shows a significant positive correlation between the proportion of Irish and percentage of population currently divorced or separated in the United States with a correlation coefficient (R) of 0.611 and weighted average of 12.5%, a difference of 8.0%.
Divorced or Separated Correlation Summary
| Measurement | Immigrants from Fiji | Irish |
| Minimum | 0.90% | 2.0% |
| Maximum | 14.9% | 70.6% |
| Range | 14.0% | 68.7% |
| Mean | 10.5% | 17.8% |
| Median | 11.3% | 12.7% |
| Interquartile 25% (IQ1) | 9.5% | 11.6% |
| Interquartile 75% (IQ3) | 12.4% | 19.3% |
| Interquartile Range (IQR) | 2.9% | 7.7% |
| Standard Deviation (Sample) | 3.2% | 12.1% |
| Standard Deviation (Population) | 3.2% | 12.1% |
Similar Demographics by Divorced or Separated
Demographics Similar to Immigrants from Fiji by Divorced or Separated
In terms of divorced or separated, the demographic groups most similar to Immigrants from Fiji are Immigrants from Denmark (11.6%, a difference of 0.010%), Arab (11.6%, a difference of 0.010%), Spanish American Indian (11.6%, a difference of 0.070%), Immigrants from Serbia (11.6%, a difference of 0.10%), and Zimbabwean (11.6%, a difference of 0.11%).
| Demographics | Rating | Rank | Divorced or Separated |
| Immigrants | Nepal | 99.2 /100 | #87 | Exceptional 11.6% |
| Immigrants | Europe | 99.2 /100 | #88 | Exceptional 11.6% |
| Immigrants | Southern Europe | 99.1 /100 | #89 | Exceptional 11.6% |
| Zimbabweans | 99.0 /100 | #90 | Exceptional 11.6% |
| Spanish American Indians | 99.0 /100 | #91 | Exceptional 11.6% |
| Immigrants | Denmark | 98.9 /100 | #92 | Exceptional 11.6% |
| Arabs | 98.9 /100 | #93 | Exceptional 11.6% |
| Immigrants | Fiji | 98.9 /100 | #94 | Exceptional 11.6% |
| Immigrants | Serbia | 98.8 /100 | #95 | Exceptional 11.6% |
| Immigrants | Ukraine | 98.7 /100 | #96 | Exceptional 11.6% |
| Latvians | 98.7 /100 | #97 | Exceptional 11.6% |
| Immigrants | Jordan | 98.6 /100 | #98 | Exceptional 11.6% |
| Immigrants | Sweden | 98.6 /100 | #99 | Exceptional 11.6% |
| Immigrants | Northern Europe | 98.6 /100 | #100 | Exceptional 11.6% |
| Immigrants | Guyana | 98.5 /100 | #101 | Exceptional 11.6% |
Demographics Similar to Irish by Divorced or Separated
In terms of divorced or separated, the demographic groups most similar to Irish are Aleut (12.5%, a difference of 0.0%), Finnish (12.5%, a difference of 0.27%), Nepalese (12.5%, a difference of 0.29%), German (12.5%, a difference of 0.31%), and Liberian (12.6%, a difference of 0.33%).
| Demographics | Rating | Rank | Divorced or Separated |
| Immigrants | Latin America | 2.8 /100 | #243 | Tragic 12.4% |
| Alaska Natives | 2.5 /100 | #244 | Tragic 12.4% |
| Hispanics or Latinos | 2.0 /100 | #245 | Tragic 12.5% |
| Immigrants | West Indies | 1.9 /100 | #246 | Tragic 12.5% |
| Germans | 1.8 /100 | #247 | Tragic 12.5% |
| Nepalese | 1.8 /100 | #248 | Tragic 12.5% |
| Finns | 1.8 /100 | #249 | Tragic 12.5% |
| Irish | 1.3 /100 | #250 | Tragic 12.5% |
| Aleuts | 1.3 /100 | #251 | Tragic 12.5% |
| Liberians | 0.9 /100 | #252 | Tragic 12.6% |
| Somalis | 0.9 /100 | #253 | Tragic 12.6% |
| Senegalese | 0.8 /100 | #254 | Tragic 12.6% |
| Welsh | 0.7 /100 | #255 | Tragic 12.6% |
| Immigrants | Colombia | 0.6 /100 | #256 | Tragic 12.6% |
| Immigrants | Somalia | 0.6 /100 | #257 | Tragic 12.6% |