Immigrants from Switzerland vs Immigrants from Liberia Average Family Size
COMPARE
Immigrants from Switzerland
Immigrants from Liberia
Average Family Size
Average Family Size Comparison
Immigrants from Switzerland
Immigrants from Liberia
3.13
AVERAGE FAMILY SIZE
0.2/ 100
METRIC RATING
304th/ 347
METRIC RANK
3.27
AVERAGE FAMILY SIZE
95.0/ 100
METRIC RATING
115th/ 347
METRIC RANK
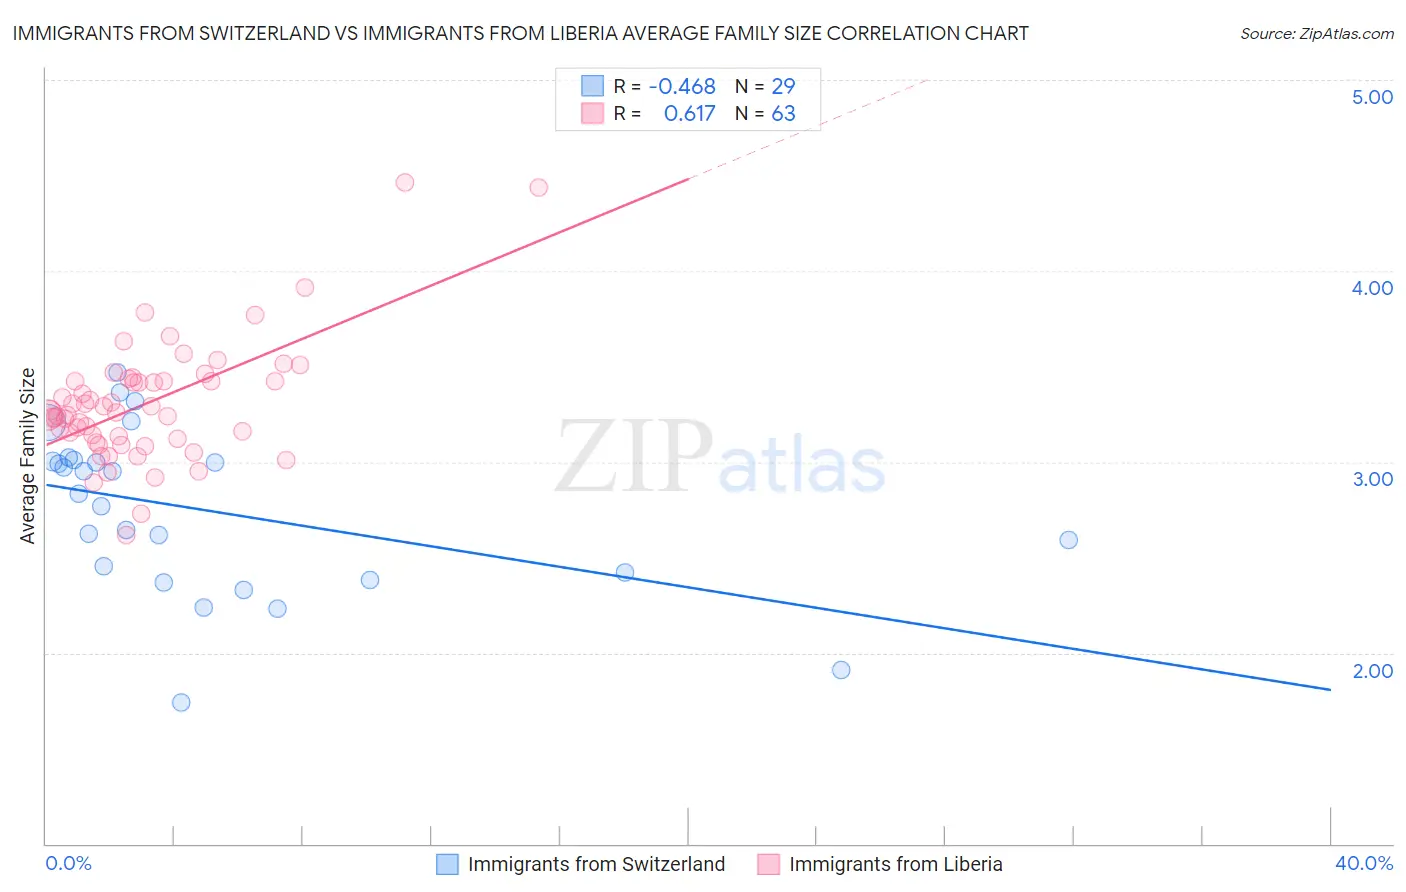
Immigrants from Switzerland vs Immigrants from Liberia Average Family Size Correlation Chart
The statistical analysis conducted on geographies consisting of 148,072,164 people shows a moderate negative correlation between the proportion of Immigrants from Switzerland and average family size in the United States with a correlation coefficient (R) of -0.468 and weighted average of 3.13. Similarly, the statistical analysis conducted on geographies consisting of 135,241,796 people shows a significant positive correlation between the proportion of Immigrants from Liberia and average family size in the United States with a correlation coefficient (R) of 0.617 and weighted average of 3.27, a difference of 4.4%.
Average Family Size Correlation Summary
| Measurement | Immigrants from Switzerland | Immigrants from Liberia |
| Minimum | 1.74 | 2.62 |
| Maximum | 3.47 | 4.46 |
| Range | 1.73 | 1.84 |
| Mean | 2.75 | 3.31 |
| Median | 2.84 | 3.26 |
| Interquartile 25% (IQ1) | 2.40 | 3.12 |
| Interquartile 75% (IQ3) | 3.01 | 3.42 |
| Interquartile Range (IQR) | 0.61 | 0.30 |
| Standard Deviation (Sample) | 0.43 | 0.32 |
| Standard Deviation (Population) | 0.42 | 0.31 |
Similar Demographics by Average Family Size
Demographics Similar to Immigrants from Switzerland by Average Family Size
In terms of average family size, the demographic groups most similar to Immigrants from Switzerland are British (3.13, a difference of 0.020%), Macedonian (3.13, a difference of 0.030%), Immigrants from Latvia (3.13, a difference of 0.030%), Australian (3.13, a difference of 0.030%), and Immigrants from Ireland (3.13, a difference of 0.090%).
| Demographics | Rating | Rank | Average Family Size |
| Immigrants | Western Europe | 0.2 /100 | #297 | Tragic 3.14 |
| Colville | 0.2 /100 | #298 | Tragic 3.14 |
| Canadians | 0.2 /100 | #299 | Tragic 3.14 |
| Immigrants | Sweden | 0.2 /100 | #300 | Tragic 3.14 |
| Macedonians | 0.2 /100 | #301 | Tragic 3.13 |
| Immigrants | Latvia | 0.2 /100 | #302 | Tragic 3.13 |
| British | 0.2 /100 | #303 | Tragic 3.13 |
| Immigrants | Switzerland | 0.2 /100 | #304 | Tragic 3.13 |
| Australians | 0.1 /100 | #305 | Tragic 3.13 |
| Immigrants | Ireland | 0.1 /100 | #306 | Tragic 3.13 |
| Immigrants | Serbia | 0.1 /100 | #307 | Tragic 3.13 |
| Slavs | 0.1 /100 | #308 | Tragic 3.13 |
| Northern Europeans | 0.1 /100 | #309 | Tragic 3.13 |
| Czechoslovakians | 0.1 /100 | #310 | Tragic 3.13 |
| Immigrants | Northern Europe | 0.1 /100 | #311 | Tragic 3.13 |
Demographics Similar to Immigrants from Liberia by Average Family Size
In terms of average family size, the demographic groups most similar to Immigrants from Liberia are Immigrants from South America (3.27, a difference of 0.0%), South American (3.27, a difference of 0.010%), Kiowa (3.27, a difference of 0.020%), Immigrants from Panama (3.27, a difference of 0.060%), and Black/African American (3.27, a difference of 0.070%).
| Demographics | Rating | Rank | Average Family Size |
| Asians | 97.0 /100 | #108 | Exceptional 3.28 |
| Puerto Ricans | 96.7 /100 | #109 | Exceptional 3.28 |
| Bahamians | 96.6 /100 | #110 | Exceptional 3.28 |
| Indonesians | 96.2 /100 | #111 | Exceptional 3.28 |
| Blacks/African Americans | 95.7 /100 | #112 | Exceptional 3.27 |
| Immigrants | Panama | 95.6 /100 | #113 | Exceptional 3.27 |
| South Americans | 95.1 /100 | #114 | Exceptional 3.27 |
| Immigrants | Liberia | 95.0 /100 | #115 | Exceptional 3.27 |
| Immigrants | South America | 95.0 /100 | #116 | Exceptional 3.27 |
| Kiowa | 94.8 /100 | #117 | Exceptional 3.27 |
| Immigrants | Asia | 94.0 /100 | #118 | Exceptional 3.27 |
| Immigrants | Indonesia | 93.7 /100 | #119 | Exceptional 3.27 |
| Immigrants | Bahamas | 93.6 /100 | #120 | Exceptional 3.27 |
| Immigrants | Thailand | 93.3 /100 | #121 | Exceptional 3.27 |
| Immigrants | Colombia | 92.8 /100 | #122 | Exceptional 3.27 |