Hawaiian vs Immigrants from Liberia Unemployment Among Ages 35 to 44 years
COMPARE
Hawaiian
Immigrants from Liberia
Unemployment Among Ages 35 to 44 years
Unemployment Among Ages 35 to 44 years Comparison
Hawaiians
Immigrants from Liberia
5.3%
UNEMPLOYMENT AMONG AGES 35 TO 44 YEARS
0.0/ 100
METRIC RATING
268th/ 347
METRIC RANK
5.2%
UNEMPLOYMENT AMONG AGES 35 TO 44 YEARS
0.2/ 100
METRIC RATING
249th/ 347
METRIC RANK
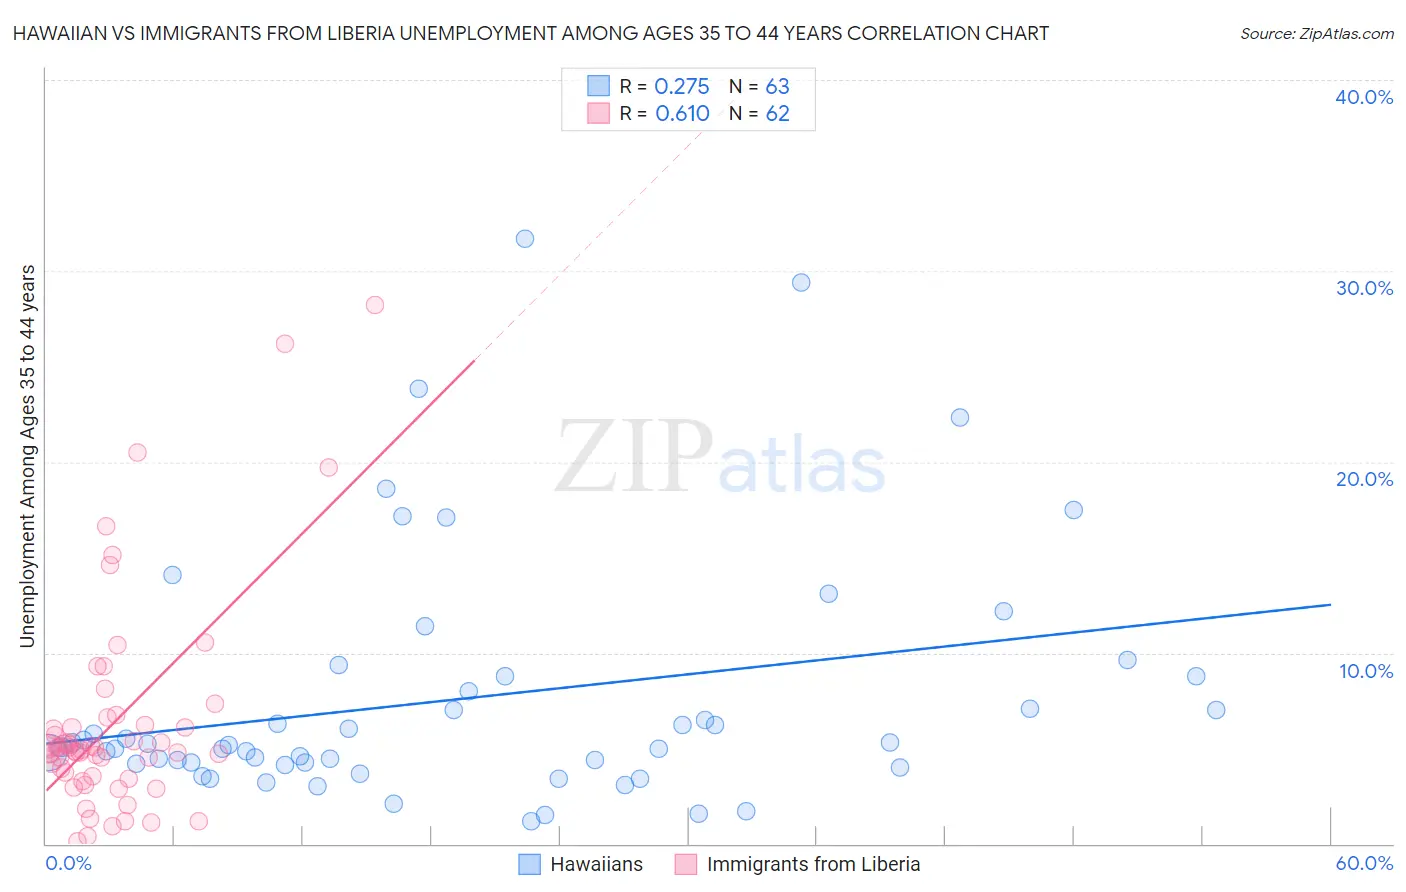
Hawaiian vs Immigrants from Liberia Unemployment Among Ages 35 to 44 years Correlation Chart
The statistical analysis conducted on geographies consisting of 321,785,588 people shows a weak positive correlation between the proportion of Hawaiians and unemployment rate among population between the ages 35 and 44 in the United States with a correlation coefficient (R) of 0.275 and weighted average of 5.3%. Similarly, the statistical analysis conducted on geographies consisting of 134,638,060 people shows a significant positive correlation between the proportion of Immigrants from Liberia and unemployment rate among population between the ages 35 and 44 in the United States with a correlation coefficient (R) of 0.610 and weighted average of 5.2%, a difference of 2.7%.
Unemployment Among Ages 35 to 44 years Correlation Summary
| Measurement | Hawaiian | Immigrants from Liberia |
| Minimum | 1.2% | 0.10% |
| Maximum | 31.7% | 28.2% |
| Range | 30.5% | 28.1% |
| Mean | 7.6% | 6.4% |
| Median | 5.2% | 5.0% |
| Interquartile 25% (IQ1) | 4.2% | 3.5% |
| Interquartile 75% (IQ3) | 8.8% | 6.2% |
| Interquartile Range (IQR) | 4.6% | 2.7% |
| Standard Deviation (Sample) | 6.5% | 5.6% |
| Standard Deviation (Population) | 6.4% | 5.6% |
Demographics Similar to Hawaiians and Immigrants from Liberia by Unemployment Among Ages 35 to 44 years
In terms of unemployment among ages 35 to 44 years, the demographic groups most similar to Hawaiians are Immigrants from Western Africa (5.3%, a difference of 0.080%), Immigrants from Bangladesh (5.3%, a difference of 0.20%), Yaqui (5.3%, a difference of 0.22%), Choctaw (5.3%, a difference of 0.41%), and Ghanaian (5.3%, a difference of 0.41%). Similarly, the demographic groups most similar to Immigrants from Liberia are Alsatian (5.2%, a difference of 0.030%), Immigrants from El Salvador (5.2%, a difference of 0.040%), Comanche (5.2%, a difference of 0.47%), Armenian (5.2%, a difference of 0.60%), and Mexican American Indian (5.2%, a difference of 0.62%).
| Demographics | Rating | Rank | Unemployment Among Ages 35 to 44 years |
| Alsatians | 0.2 /100 | #248 | Tragic 5.2% |
| Immigrants | Liberia | 0.2 /100 | #249 | Tragic 5.2% |
| Immigrants | El Salvador | 0.2 /100 | #250 | Tragic 5.2% |
| Comanche | 0.2 /100 | #251 | Tragic 5.2% |
| Armenians | 0.2 /100 | #252 | Tragic 5.2% |
| Mexican American Indians | 0.2 /100 | #253 | Tragic 5.2% |
| Immigrants | Bahamas | 0.2 /100 | #254 | Tragic 5.2% |
| Cherokee | 0.2 /100 | #255 | Tragic 5.2% |
| Seminole | 0.1 /100 | #256 | Tragic 5.2% |
| Immigrants | Fiji | 0.1 /100 | #257 | Tragic 5.3% |
| Immigrants | Latin America | 0.1 /100 | #258 | Tragic 5.3% |
| Mexicans | 0.1 /100 | #259 | Tragic 5.3% |
| Sub-Saharan Africans | 0.1 /100 | #260 | Tragic 5.3% |
| Spanish Americans | 0.1 /100 | #261 | Tragic 5.3% |
| Immigrants | Central America | 0.1 /100 | #262 | Tragic 5.3% |
| Choctaw | 0.1 /100 | #263 | Tragic 5.3% |
| Ghanaians | 0.1 /100 | #264 | Tragic 5.3% |
| Yaqui | 0.1 /100 | #265 | Tragic 5.3% |
| Immigrants | Bangladesh | 0.1 /100 | #266 | Tragic 5.3% |
| Immigrants | Western Africa | 0.0 /100 | #267 | Tragic 5.3% |
| Hawaiians | 0.0 /100 | #268 | Tragic 5.3% |