Immigrants from Dominican Republic vs Bangladeshi Single Mother Households
COMPARE
Immigrants from Dominican Republic
Bangladeshi
Single Mother Households
Single Mother Households Comparison
Immigrants from Dominican Republic
Bangladeshis
9.5%
SINGLE MOTHER HOUSEHOLDS
0.0/ 100
METRIC RATING
344th/ 347
METRIC RANK
8.1%
SINGLE MOTHER HOUSEHOLDS
0.0/ 100
METRIC RATING
312th/ 347
METRIC RANK
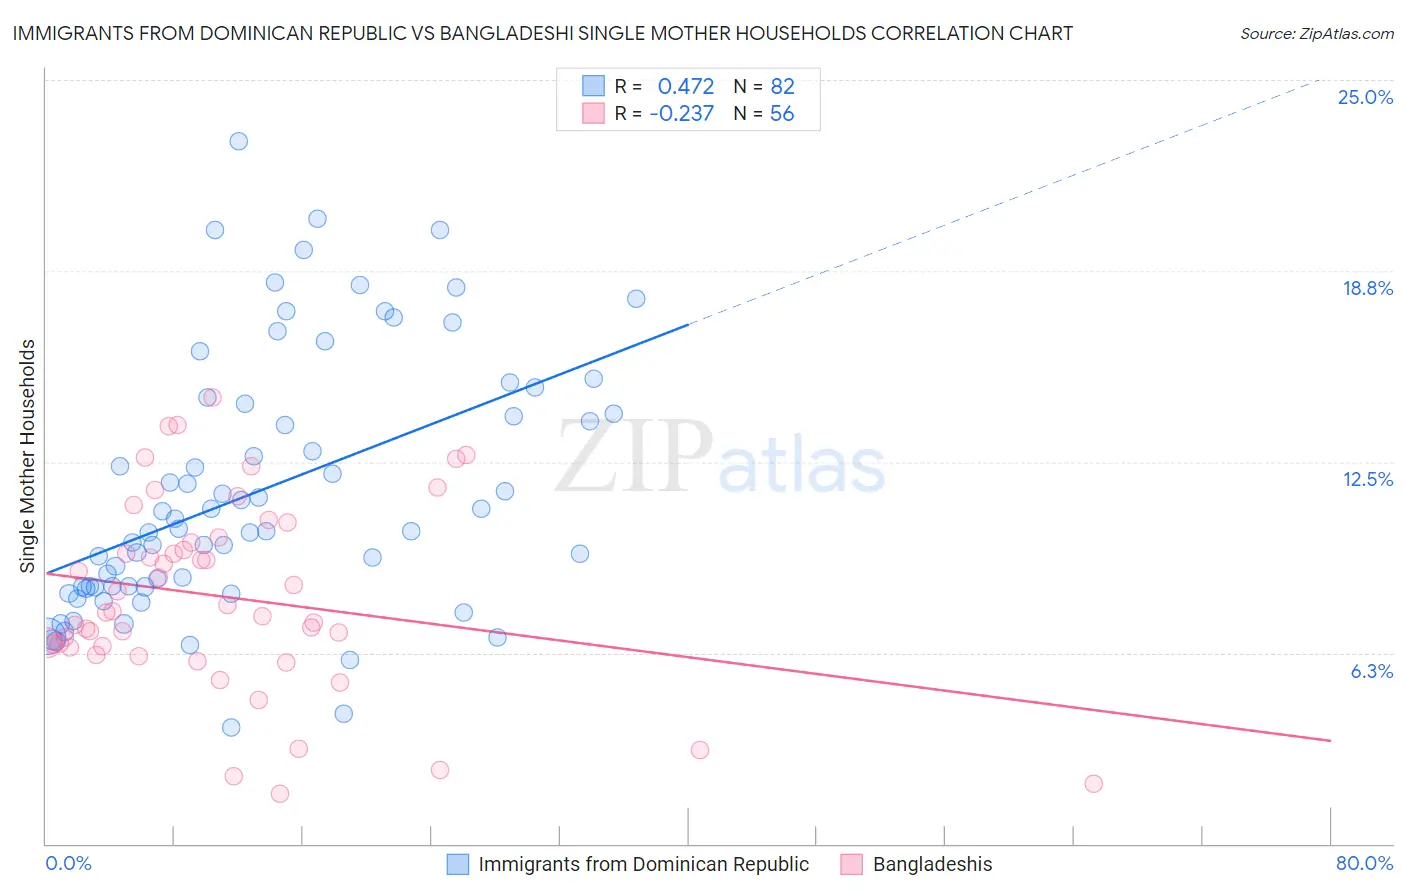
Immigrants from Dominican Republic vs Bangladeshi Single Mother Households Correlation Chart
The statistical analysis conducted on geographies consisting of 274,598,570 people shows a moderate positive correlation between the proportion of Immigrants from Dominican Republic and percentage of single mother households in the United States with a correlation coefficient (R) of 0.472 and weighted average of 9.5%. Similarly, the statistical analysis conducted on geographies consisting of 141,271,331 people shows a weak negative correlation between the proportion of Bangladeshis and percentage of single mother households in the United States with a correlation coefficient (R) of -0.237 and weighted average of 8.1%, a difference of 16.8%.
Single Mother Households Correlation Summary
| Measurement | Immigrants from Dominican Republic | Bangladeshi |
| Minimum | 3.8% | 1.7% |
| Maximum | 23.0% | 14.6% |
| Range | 19.2% | 13.0% |
| Mean | 11.5% | 8.1% |
| Median | 10.3% | 7.6% |
| Interquartile 25% (IQ1) | 8.4% | 6.4% |
| Interquartile 75% (IQ3) | 14.4% | 9.9% |
| Interquartile Range (IQR) | 6.0% | 3.5% |
| Standard Deviation (Sample) | 4.2% | 3.1% |
| Standard Deviation (Population) | 4.2% | 3.1% |
Similar Demographics by Single Mother Households
Demographics Similar to Immigrants from Dominican Republic by Single Mother Households
In terms of single mother households, the demographic groups most similar to Immigrants from Dominican Republic are Immigrants from Cabo Verde (9.6%, a difference of 0.78%), Yuman (9.6%, a difference of 1.4%), Dominican (9.2%, a difference of 3.5%), Menominee (9.2%, a difference of 3.7%), and Tohono O'odham (9.1%, a difference of 4.1%).
| Demographics | Rating | Rank | Single Mother Households |
| Liberians | 0.0 /100 | #333 | Tragic 8.6% |
| Immigrants | Liberia | 0.0 /100 | #334 | Tragic 8.7% |
| Immigrants | Dominica | 0.0 /100 | #335 | Tragic 8.7% |
| Puerto Ricans | 0.0 /100 | #336 | Tragic 8.7% |
| Navajo | 0.0 /100 | #337 | Tragic 8.8% |
| Cape Verdeans | 0.0 /100 | #338 | Tragic 8.9% |
| Blacks/African Americans | 0.0 /100 | #339 | Tragic 9.0% |
| Lumbee | 0.0 /100 | #340 | Tragic 9.1% |
| Tohono O'odham | 0.0 /100 | #341 | Tragic 9.1% |
| Menominee | 0.0 /100 | #342 | Tragic 9.2% |
| Dominicans | 0.0 /100 | #343 | Tragic 9.2% |
| Immigrants | Dominican Republic | 0.0 /100 | #344 | Tragic 9.5% |
| Immigrants | Cabo Verde | 0.0 /100 | #345 | Tragic 9.6% |
| Yuman | 0.0 /100 | #346 | Tragic 9.6% |
| Yup'ik | 0.0 /100 | #347 | Tragic 10.0% |
Demographics Similar to Bangladeshis by Single Mother Households
In terms of single mother households, the demographic groups most similar to Bangladeshis are Immigrants from Grenada (8.2%, a difference of 0.16%), Immigrants from Mexico (8.2%, a difference of 0.28%), Immigrants from Congo (8.1%, a difference of 0.29%), Immigrants from Western Africa (8.2%, a difference of 0.31%), and African (8.2%, a difference of 0.46%).
| Demographics | Rating | Rank | Single Mother Households |
| Colville | 0.0 /100 | #305 | Tragic 8.0% |
| Immigrants | Barbados | 0.0 /100 | #306 | Tragic 8.0% |
| Immigrants | St. Vincent and the Grenadines | 0.0 /100 | #307 | Tragic 8.0% |
| Immigrants | Central America | 0.0 /100 | #308 | Tragic 8.1% |
| Cheyenne | 0.0 /100 | #309 | Tragic 8.1% |
| Hondurans | 0.0 /100 | #310 | Tragic 8.1% |
| Immigrants | Congo | 0.0 /100 | #311 | Tragic 8.1% |
| Bangladeshis | 0.0 /100 | #312 | Tragic 8.1% |
| Immigrants | Grenada | 0.0 /100 | #313 | Tragic 8.2% |
| Immigrants | Mexico | 0.0 /100 | #314 | Tragic 8.2% |
| Immigrants | Western Africa | 0.0 /100 | #315 | Tragic 8.2% |
| Africans | 0.0 /100 | #316 | Tragic 8.2% |
| Immigrants | Honduras | 0.0 /100 | #317 | Tragic 8.2% |
| Senegalese | 0.0 /100 | #318 | Tragic 8.2% |
| Jamaicans | 0.0 /100 | #319 | Tragic 8.2% |