Greek vs Immigrants from Armenia Single Mother Households
COMPARE
Greek
Immigrants from Armenia
Single Mother Households
Single Mother Households Comparison
Greeks
Immigrants from Armenia
5.6%
SINGLE MOTHER HOUSEHOLDS
98.6/ 100
METRIC RATING
65th/ 347
METRIC RANK
5.2%
SINGLE MOTHER HOUSEHOLDS
99.9/ 100
METRIC RATING
18th/ 347
METRIC RANK
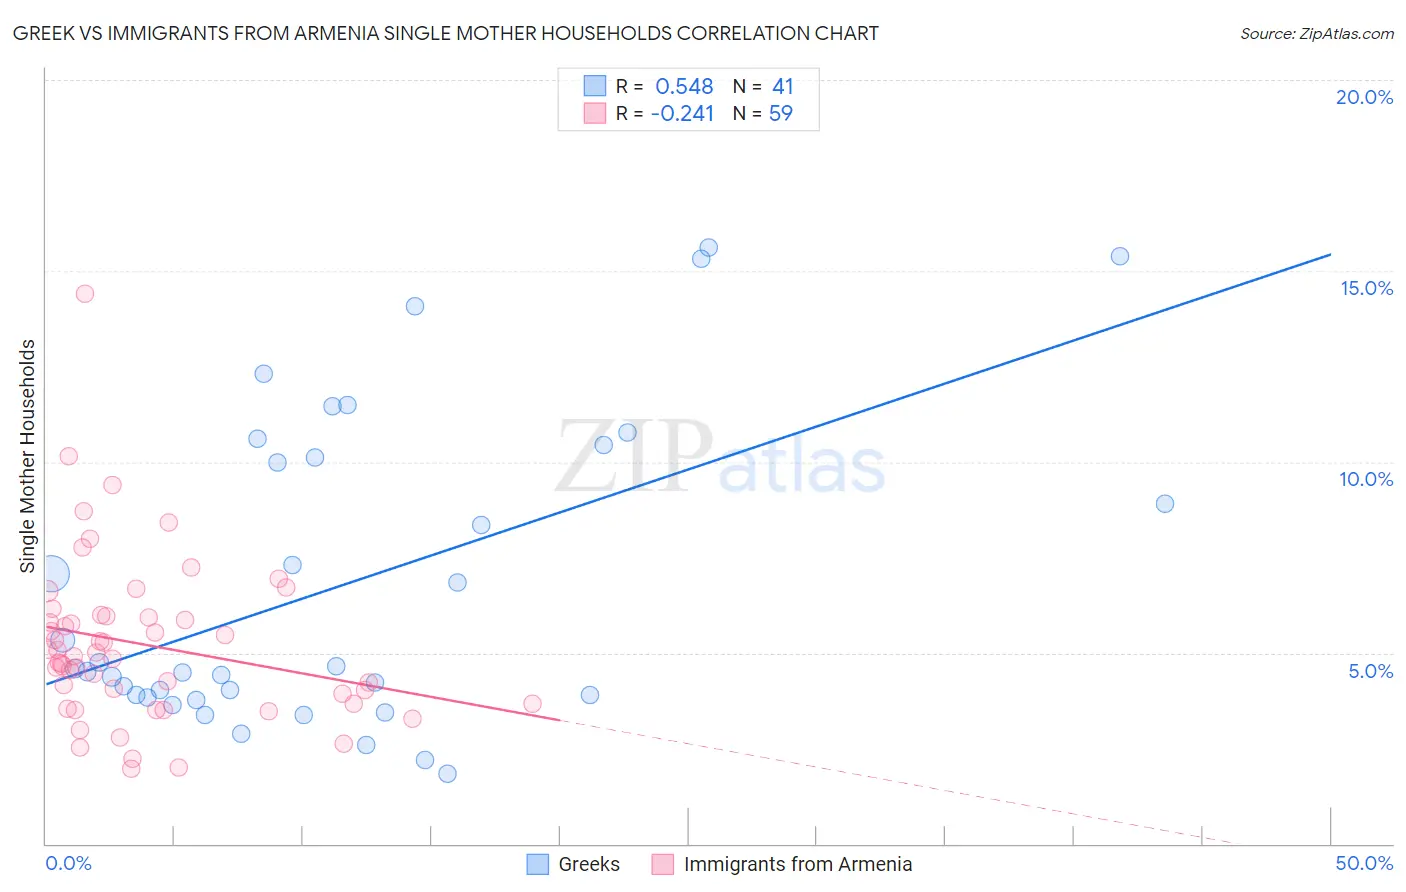
Greek vs Immigrants from Armenia Single Mother Households Correlation Chart
The statistical analysis conducted on geographies consisting of 480,310,145 people shows a substantial positive correlation between the proportion of Greeks and percentage of single mother households in the United States with a correlation coefficient (R) of 0.548 and weighted average of 5.6%. Similarly, the statistical analysis conducted on geographies consisting of 97,664,769 people shows a weak negative correlation between the proportion of Immigrants from Armenia and percentage of single mother households in the United States with a correlation coefficient (R) of -0.241 and weighted average of 5.2%, a difference of 8.2%.
Single Mother Households Correlation Summary
| Measurement | Greek | Immigrants from Armenia |
| Minimum | 1.8% | 2.0% |
| Maximum | 15.6% | 14.4% |
| Range | 13.8% | 12.4% |
| Mean | 6.8% | 5.2% |
| Median | 4.6% | 4.9% |
| Interquartile 25% (IQ1) | 3.9% | 3.7% |
| Interquartile 75% (IQ3) | 10.3% | 6.0% |
| Interquartile Range (IQR) | 6.4% | 2.3% |
| Standard Deviation (Sample) | 4.0% | 2.2% |
| Standard Deviation (Population) | 4.0% | 2.1% |
Similar Demographics by Single Mother Households
Demographics Similar to Greeks by Single Mother Households
In terms of single mother households, the demographic groups most similar to Greeks are Immigrants from France (5.6%, a difference of 0.040%), Immigrants from North Macedonia (5.6%, a difference of 0.080%), Immigrants from Canada (5.6%, a difference of 0.10%), Italian (5.6%, a difference of 0.12%), and Polish (5.6%, a difference of 0.15%).
| Demographics | Rating | Rank | Single Mother Households |
| Danes | 98.9 /100 | #58 | Exceptional 5.5% |
| Luxembourgers | 98.7 /100 | #59 | Exceptional 5.6% |
| Immigrants | Norway | 98.7 /100 | #60 | Exceptional 5.6% |
| Australians | 98.7 /100 | #61 | Exceptional 5.6% |
| Poles | 98.6 /100 | #62 | Exceptional 5.6% |
| Immigrants | North Macedonia | 98.6 /100 | #63 | Exceptional 5.6% |
| Immigrants | France | 98.6 /100 | #64 | Exceptional 5.6% |
| Greeks | 98.6 /100 | #65 | Exceptional 5.6% |
| Immigrants | Canada | 98.5 /100 | #66 | Exceptional 5.6% |
| Italians | 98.5 /100 | #67 | Exceptional 5.6% |
| Immigrants | Bulgaria | 98.5 /100 | #68 | Exceptional 5.6% |
| Asians | 98.5 /100 | #69 | Exceptional 5.6% |
| Immigrants | Eastern Europe | 98.4 /100 | #70 | Exceptional 5.6% |
| Immigrants | Kazakhstan | 98.4 /100 | #71 | Exceptional 5.6% |
| Immigrants | Netherlands | 98.4 /100 | #72 | Exceptional 5.6% |
Demographics Similar to Immigrants from Armenia by Single Mother Households
In terms of single mother households, the demographic groups most similar to Immigrants from Armenia are Chinese (5.2%, a difference of 0.11%), Maltese (5.2%, a difference of 0.57%), Eastern European (5.2%, a difference of 0.63%), Soviet Union (5.1%, a difference of 0.78%), and Indian (Asian) (5.1%, a difference of 0.99%).
| Demographics | Rating | Rank | Single Mother Households |
| Immigrants | China | 99.9 /100 | #11 | Exceptional 5.1% |
| Cypriots | 99.9 /100 | #12 | Exceptional 5.1% |
| Immigrants | India | 99.9 /100 | #13 | Exceptional 5.1% |
| Immigrants | Australia | 99.9 /100 | #14 | Exceptional 5.1% |
| Immigrants | Eastern Asia | 99.9 /100 | #15 | Exceptional 5.1% |
| Indians (Asian) | 99.9 /100 | #16 | Exceptional 5.1% |
| Soviet Union | 99.9 /100 | #17 | Exceptional 5.1% |
| Immigrants | Armenia | 99.9 /100 | #18 | Exceptional 5.2% |
| Chinese | 99.9 /100 | #19 | Exceptional 5.2% |
| Maltese | 99.9 /100 | #20 | Exceptional 5.2% |
| Eastern Europeans | 99.8 /100 | #21 | Exceptional 5.2% |
| Thais | 99.8 /100 | #22 | Exceptional 5.2% |
| Immigrants | Austria | 99.8 /100 | #23 | Exceptional 5.2% |
| Armenians | 99.8 /100 | #24 | Exceptional 5.2% |
| Immigrants | Japan | 99.8 /100 | #25 | Exceptional 5.2% |