Greek vs Blackfeet Single Father Households
COMPARE
Greek
Blackfeet
Single Father Households
Single Father Households Comparison
Greeks
Blackfeet
2.1%
SINGLE FATHER HOUSEHOLDS
99.7/ 100
METRIC RATING
83rd/ 347
METRIC RANK
2.7%
SINGLE FATHER HOUSEHOLDS
0.0/ 100
METRIC RATING
291st/ 347
METRIC RANK
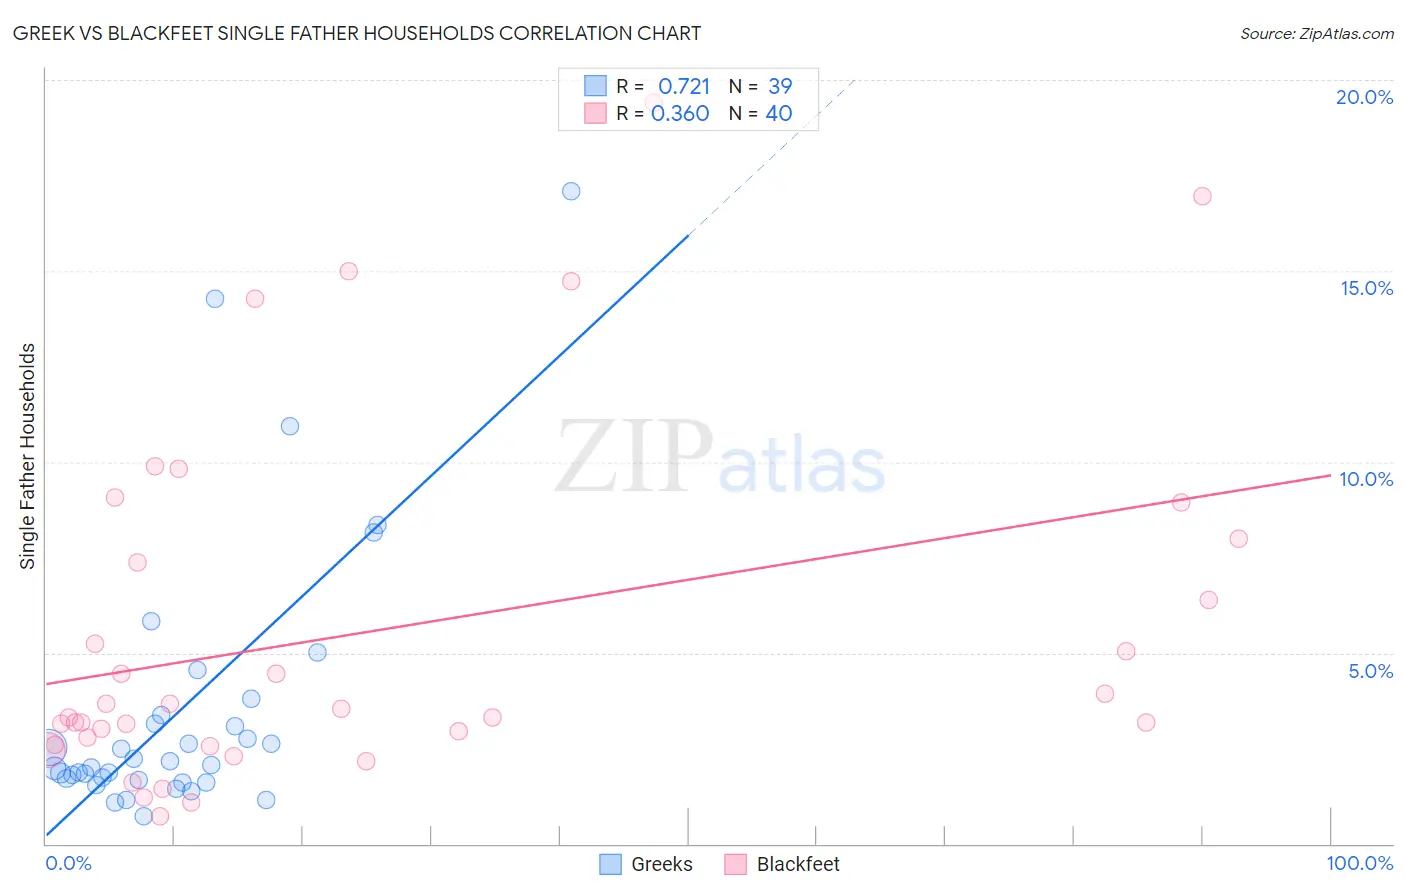
Greek vs Blackfeet Single Father Households Correlation Chart
The statistical analysis conducted on geographies consisting of 475,873,790 people shows a strong positive correlation between the proportion of Greeks and percentage of single father households in the United States with a correlation coefficient (R) of 0.721 and weighted average of 2.1%. Similarly, the statistical analysis conducted on geographies consisting of 307,723,942 people shows a mild positive correlation between the proportion of Blackfeet and percentage of single father households in the United States with a correlation coefficient (R) of 0.360 and weighted average of 2.7%, a difference of 29.2%.
Single Father Households Correlation Summary
| Measurement | Greek | Blackfeet |
| Minimum | 0.73% | 0.71% |
| Maximum | 17.1% | 19.4% |
| Range | 16.3% | 18.7% |
| Mean | 3.5% | 5.6% |
| Median | 2.1% | 3.4% |
| Interquartile 25% (IQ1) | 1.7% | 2.7% |
| Interquartile 75% (IQ3) | 3.4% | 7.7% |
| Interquartile Range (IQR) | 1.7% | 5.0% |
| Standard Deviation (Sample) | 3.6% | 4.7% |
| Standard Deviation (Population) | 3.6% | 4.6% |
Similar Demographics by Single Father Households
Demographics Similar to Greeks by Single Father Households
In terms of single father households, the demographic groups most similar to Greeks are New Zealander (2.1%, a difference of 0.010%), Armenian (2.1%, a difference of 0.060%), Immigrants from South Africa (2.1%, a difference of 0.14%), Immigrants from Asia (2.1%, a difference of 0.23%), and Carpatho Rusyn (2.1%, a difference of 0.30%).
| Demographics | Rating | Rank | Single Father Households |
| Immigrants | Scotland | 99.8 /100 | #76 | Exceptional 2.1% |
| Immigrants | Saudi Arabia | 99.8 /100 | #77 | Exceptional 2.1% |
| Estonians | 99.7 /100 | #78 | Exceptional 2.1% |
| Immigrants | Asia | 99.7 /100 | #79 | Exceptional 2.1% |
| Immigrants | South Africa | 99.7 /100 | #80 | Exceptional 2.1% |
| Armenians | 99.7 /100 | #81 | Exceptional 2.1% |
| New Zealanders | 99.7 /100 | #82 | Exceptional 2.1% |
| Greeks | 99.7 /100 | #83 | Exceptional 2.1% |
| Carpatho Rusyns | 99.6 /100 | #84 | Exceptional 2.1% |
| Immigrants | Hungary | 99.6 /100 | #85 | Exceptional 2.1% |
| Asians | 99.6 /100 | #86 | Exceptional 2.1% |
| Lithuanians | 99.5 /100 | #87 | Exceptional 2.1% |
| Bhutanese | 99.5 /100 | #88 | Exceptional 2.1% |
| Immigrants | Armenia | 99.5 /100 | #89 | Exceptional 2.1% |
| Immigrants | Pakistan | 99.5 /100 | #90 | Exceptional 2.1% |
Demographics Similar to Blackfeet by Single Father Households
In terms of single father households, the demographic groups most similar to Blackfeet are Choctaw (2.7%, a difference of 0.46%), Puget Sound Salish (2.7%, a difference of 0.56%), Immigrants from Fiji (2.7%, a difference of 0.62%), Tlingit-Haida (2.7%, a difference of 1.0%), and Malaysian (2.7%, a difference of 1.1%).
| Demographics | Rating | Rank | Single Father Households |
| Hawaiians | 0.1 /100 | #284 | Tragic 2.7% |
| Ottawa | 0.1 /100 | #285 | Tragic 2.7% |
| Immigrants | Cuba | 0.1 /100 | #286 | Tragic 2.7% |
| Central American Indians | 0.0 /100 | #287 | Tragic 2.7% |
| Immigrants | Cambodia | 0.0 /100 | #288 | Tragic 2.7% |
| Tlingit-Haida | 0.0 /100 | #289 | Tragic 2.7% |
| Puget Sound Salish | 0.0 /100 | #290 | Tragic 2.7% |
| Blackfeet | 0.0 /100 | #291 | Tragic 2.7% |
| Choctaw | 0.0 /100 | #292 | Tragic 2.7% |
| Immigrants | Fiji | 0.0 /100 | #293 | Tragic 2.7% |
| Malaysians | 0.0 /100 | #294 | Tragic 2.7% |
| Chickasaw | 0.0 /100 | #295 | Tragic 2.8% |
| Japanese | 0.0 /100 | #296 | Tragic 2.8% |
| Hondurans | 0.0 /100 | #297 | Tragic 2.8% |
| Cree | 0.0 /100 | #298 | Tragic 2.8% |