Brazilian vs Blackfeet Single Father Households
COMPARE
Brazilian
Blackfeet
Single Father Households
Single Father Households Comparison
Brazilians
Blackfeet
2.2%
SINGLE FATHER HOUSEHOLDS
92.8/ 100
METRIC RATING
139th/ 347
METRIC RANK
2.7%
SINGLE FATHER HOUSEHOLDS
0.0/ 100
METRIC RATING
291st/ 347
METRIC RANK
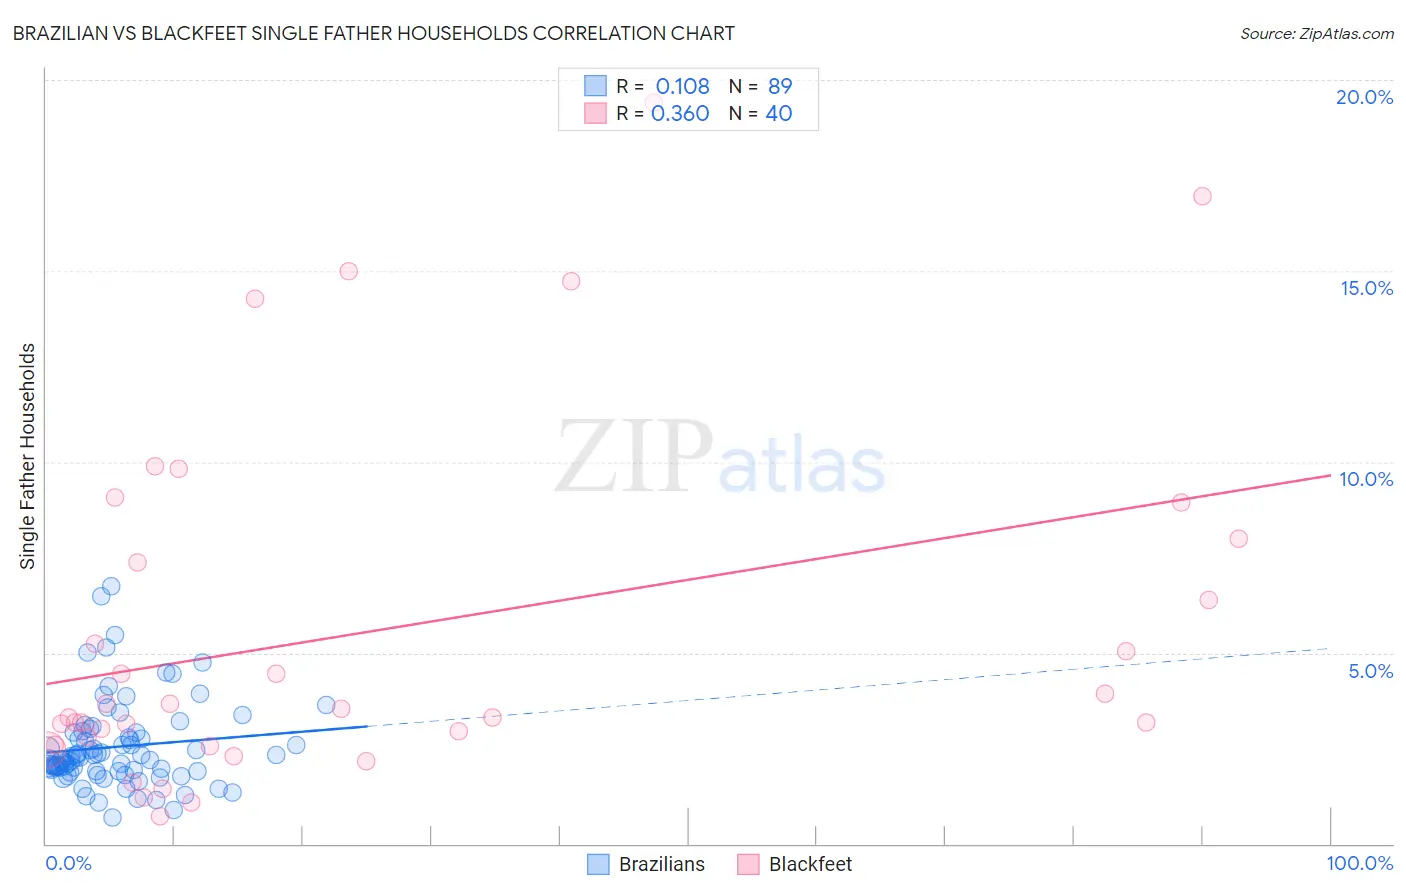
Brazilian vs Blackfeet Single Father Households Correlation Chart
The statistical analysis conducted on geographies consisting of 321,679,292 people shows a poor positive correlation between the proportion of Brazilians and percentage of single father households in the United States with a correlation coefficient (R) of 0.108 and weighted average of 2.2%. Similarly, the statistical analysis conducted on geographies consisting of 307,723,942 people shows a mild positive correlation between the proportion of Blackfeet and percentage of single father households in the United States with a correlation coefficient (R) of 0.360 and weighted average of 2.7%, a difference of 21.2%.
Single Father Households Correlation Summary
| Measurement | Brazilian | Blackfeet |
| Minimum | 0.67% | 0.71% |
| Maximum | 6.7% | 19.4% |
| Range | 6.1% | 18.7% |
| Mean | 2.5% | 5.6% |
| Median | 2.2% | 3.4% |
| Interquartile 25% (IQ1) | 1.9% | 2.7% |
| Interquartile 75% (IQ3) | 2.9% | 7.7% |
| Interquartile Range (IQR) | 1.0% | 5.0% |
| Standard Deviation (Sample) | 1.1% | 4.7% |
| Standard Deviation (Population) | 1.1% | 4.6% |
Similar Demographics by Single Father Households
Demographics Similar to Brazilians by Single Father Households
In terms of single father households, the demographic groups most similar to Brazilians are British (2.2%, a difference of 0.010%), Laotian (2.2%, a difference of 0.090%), Luxembourger (2.2%, a difference of 0.13%), Immigrants from Nepal (2.2%, a difference of 0.19%), and West Indian (2.2%, a difference of 0.42%).
| Demographics | Rating | Rank | Single Father Households |
| Poles | 96.5 /100 | #132 | Exceptional 2.2% |
| Taiwanese | 96.3 /100 | #133 | Exceptional 2.2% |
| Zimbabweans | 95.1 /100 | #134 | Exceptional 2.2% |
| Syrians | 94.8 /100 | #135 | Exceptional 2.2% |
| Chileans | 94.5 /100 | #136 | Exceptional 2.2% |
| Austrians | 94.2 /100 | #137 | Exceptional 2.2% |
| West Indians | 94.1 /100 | #138 | Exceptional 2.2% |
| Brazilians | 92.8 /100 | #139 | Exceptional 2.2% |
| British | 92.8 /100 | #140 | Exceptional 2.2% |
| Laotians | 92.5 /100 | #141 | Exceptional 2.2% |
| Luxembourgers | 92.3 /100 | #142 | Exceptional 2.2% |
| Immigrants | Nepal | 92.1 /100 | #143 | Exceptional 2.2% |
| Slovaks | 90.7 /100 | #144 | Exceptional 2.2% |
| Immigrants | Zimbabwe | 90.2 /100 | #145 | Exceptional 2.2% |
| Northern Europeans | 89.8 /100 | #146 | Excellent 2.2% |
Demographics Similar to Blackfeet by Single Father Households
In terms of single father households, the demographic groups most similar to Blackfeet are Choctaw (2.7%, a difference of 0.46%), Puget Sound Salish (2.7%, a difference of 0.56%), Immigrants from Fiji (2.7%, a difference of 0.62%), Tlingit-Haida (2.7%, a difference of 1.0%), and Malaysian (2.7%, a difference of 1.1%).
| Demographics | Rating | Rank | Single Father Households |
| Hawaiians | 0.1 /100 | #284 | Tragic 2.7% |
| Ottawa | 0.1 /100 | #285 | Tragic 2.7% |
| Immigrants | Cuba | 0.1 /100 | #286 | Tragic 2.7% |
| Central American Indians | 0.0 /100 | #287 | Tragic 2.7% |
| Immigrants | Cambodia | 0.0 /100 | #288 | Tragic 2.7% |
| Tlingit-Haida | 0.0 /100 | #289 | Tragic 2.7% |
| Puget Sound Salish | 0.0 /100 | #290 | Tragic 2.7% |
| Blackfeet | 0.0 /100 | #291 | Tragic 2.7% |
| Choctaw | 0.0 /100 | #292 | Tragic 2.7% |
| Immigrants | Fiji | 0.0 /100 | #293 | Tragic 2.7% |
| Malaysians | 0.0 /100 | #294 | Tragic 2.7% |
| Chickasaw | 0.0 /100 | #295 | Tragic 2.8% |
| Japanese | 0.0 /100 | #296 | Tragic 2.8% |
| Hondurans | 0.0 /100 | #297 | Tragic 2.8% |
| Cree | 0.0 /100 | #298 | Tragic 2.8% |