Greek vs Blackfeet Unemployment Among Ages 45 to 54 years
COMPARE
Greek
Blackfeet
Unemployment Among Ages 45 to 54 years
Unemployment Among Ages 45 to 54 years Comparison
Greeks
Blackfeet
4.3%
UNEMPLOYMENT AMONG AGES 45 TO 54 YEARS
99.3/ 100
METRIC RATING
58th/ 347
METRIC RANK
5.1%
UNEMPLOYMENT AMONG AGES 45 TO 54 YEARS
0.0/ 100
METRIC RATING
280th/ 347
METRIC RANK
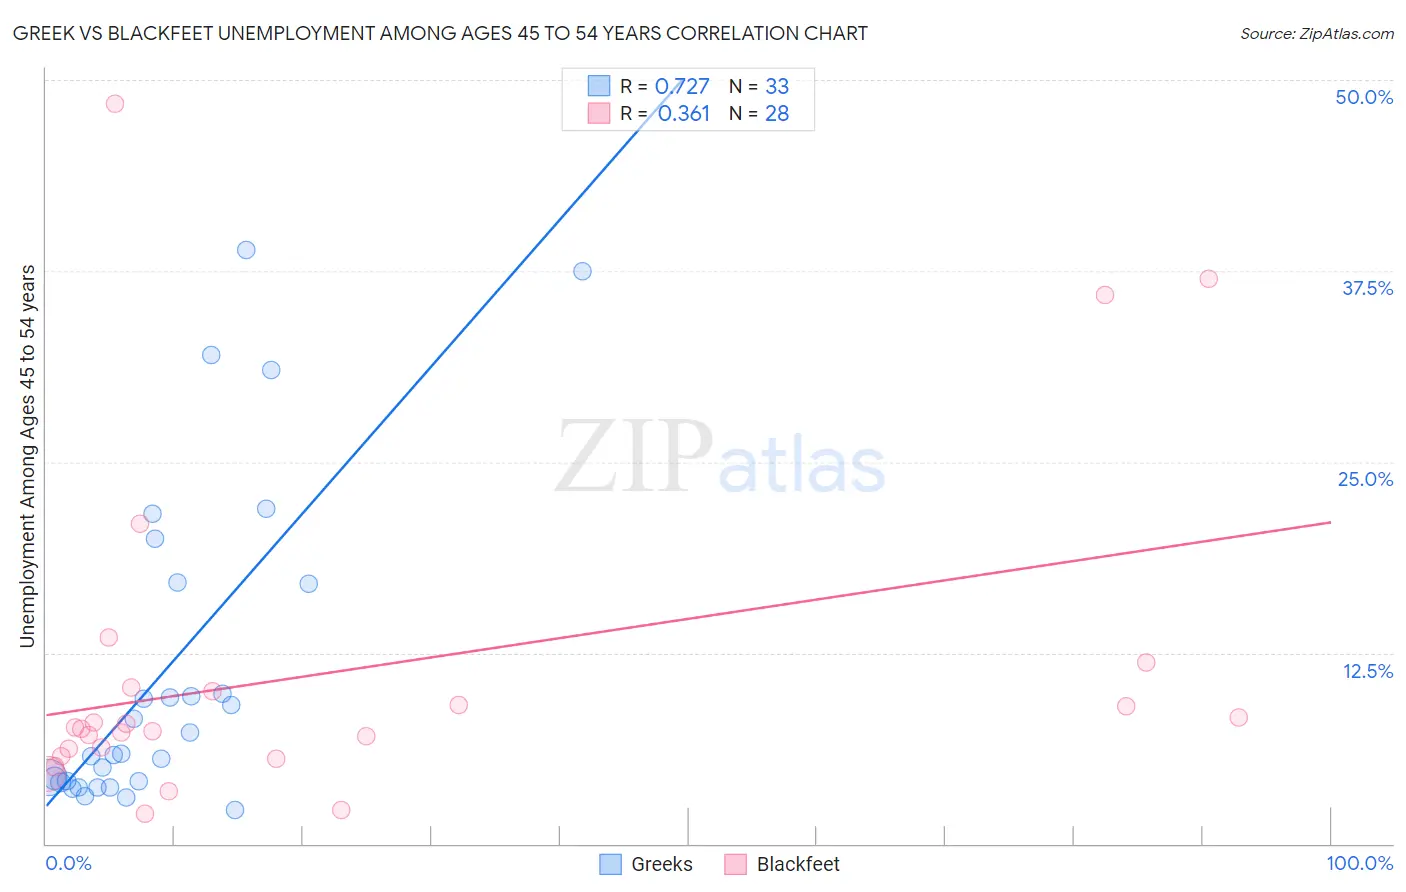
Greek vs Blackfeet Unemployment Among Ages 45 to 54 years Correlation Chart
The statistical analysis conducted on geographies consisting of 463,102,299 people shows a strong positive correlation between the proportion of Greeks and unemployment rate among population between the ages 45 and 54 in the United States with a correlation coefficient (R) of 0.727 and weighted average of 4.3%. Similarly, the statistical analysis conducted on geographies consisting of 302,050,143 people shows a mild positive correlation between the proportion of Blackfeet and unemployment rate among population between the ages 45 and 54 in the United States with a correlation coefficient (R) of 0.361 and weighted average of 5.1%, a difference of 18.6%.
Unemployment Among Ages 45 to 54 years Correlation Summary
| Measurement | Greek | Blackfeet |
| Minimum | 2.2% | 2.0% |
| Maximum | 38.9% | 48.4% |
| Range | 36.7% | 46.4% |
| Mean | 11.3% | 11.2% |
| Median | 5.9% | 7.6% |
| Interquartile 25% (IQ1) | 4.0% | 6.0% |
| Interquartile 75% (IQ3) | 17.1% | 10.1% |
| Interquartile Range (IQR) | 13.0% | 4.1% |
| Standard Deviation (Sample) | 10.5% | 11.1% |
| Standard Deviation (Population) | 10.3% | 10.9% |
Similar Demographics by Unemployment Among Ages 45 to 54 years
Demographics Similar to Greeks by Unemployment Among Ages 45 to 54 years
In terms of unemployment among ages 45 to 54 years, the demographic groups most similar to Greeks are Immigrants from Sri Lanka (4.3%, a difference of 0.050%), Okinawan (4.3%, a difference of 0.080%), Immigrants from Jordan (4.3%, a difference of 0.11%), Immigrants from Korea (4.3%, a difference of 0.11%), and Immigrants from Pakistan (4.3%, a difference of 0.11%).
| Demographics | Rating | Rank | Unemployment Among Ages 45 to 54 years |
| Burmese | 99.6 /100 | #51 | Exceptional 4.2% |
| Poles | 99.5 /100 | #52 | Exceptional 4.2% |
| Irish | 99.5 /100 | #53 | Exceptional 4.2% |
| Chickasaw | 99.5 /100 | #54 | Exceptional 4.2% |
| Latvians | 99.4 /100 | #55 | Exceptional 4.2% |
| Immigrants | Jordan | 99.3 /100 | #56 | Exceptional 4.3% |
| Immigrants | Sri Lanka | 99.3 /100 | #57 | Exceptional 4.3% |
| Greeks | 99.3 /100 | #58 | Exceptional 4.3% |
| Okinawans | 99.2 /100 | #59 | Exceptional 4.3% |
| Immigrants | Korea | 99.2 /100 | #60 | Exceptional 4.3% |
| Immigrants | Pakistan | 99.2 /100 | #61 | Exceptional 4.3% |
| Lithuanians | 99.1 /100 | #62 | Exceptional 4.3% |
| Pennsylvania Germans | 99.1 /100 | #63 | Exceptional 4.3% |
| Austrians | 99.0 /100 | #64 | Exceptional 4.3% |
| Immigrants | Sudan | 99.0 /100 | #65 | Exceptional 4.3% |
Demographics Similar to Blackfeet by Unemployment Among Ages 45 to 54 years
In terms of unemployment among ages 45 to 54 years, the demographic groups most similar to Blackfeet are Spanish American Indian (5.1%, a difference of 0.080%), Nepalese (5.0%, a difference of 0.21%), African (5.1%, a difference of 0.23%), Dutch West Indian (5.0%, a difference of 0.35%), and Immigrants from Mexico (5.0%, a difference of 0.55%).
| Demographics | Rating | Rank | Unemployment Among Ages 45 to 54 years |
| Immigrants | Latin America | 0.0 /100 | #273 | Tragic 5.0% |
| U.S. Virgin Islanders | 0.0 /100 | #274 | Tragic 5.0% |
| Bermudans | 0.0 /100 | #275 | Tragic 5.0% |
| French American Indians | 0.0 /100 | #276 | Tragic 5.0% |
| Immigrants | Mexico | 0.0 /100 | #277 | Tragic 5.0% |
| Dutch West Indians | 0.0 /100 | #278 | Tragic 5.0% |
| Nepalese | 0.0 /100 | #279 | Tragic 5.0% |
| Blackfeet | 0.0 /100 | #280 | Tragic 5.1% |
| Spanish American Indians | 0.0 /100 | #281 | Tragic 5.1% |
| Africans | 0.0 /100 | #282 | Tragic 5.1% |
| Hispanics or Latinos | 0.0 /100 | #283 | Tragic 5.1% |
| Kiowa | 0.0 /100 | #284 | Tragic 5.1% |
| Iroquois | 0.0 /100 | #285 | Tragic 5.1% |
| Senegalese | 0.0 /100 | #286 | Tragic 5.1% |
| Haitians | 0.0 /100 | #287 | Tragic 5.2% |