Immigrants from Switzerland vs Blackfeet Single Father Households
COMPARE
Immigrants from Switzerland
Blackfeet
Single Father Households
Single Father Households Comparison
Immigrants from Switzerland
Blackfeet
2.0%
SINGLE FATHER HOUSEHOLDS
99.9/ 100
METRIC RATING
50th/ 347
METRIC RANK
2.7%
SINGLE FATHER HOUSEHOLDS
0.0/ 100
METRIC RATING
291st/ 347
METRIC RANK
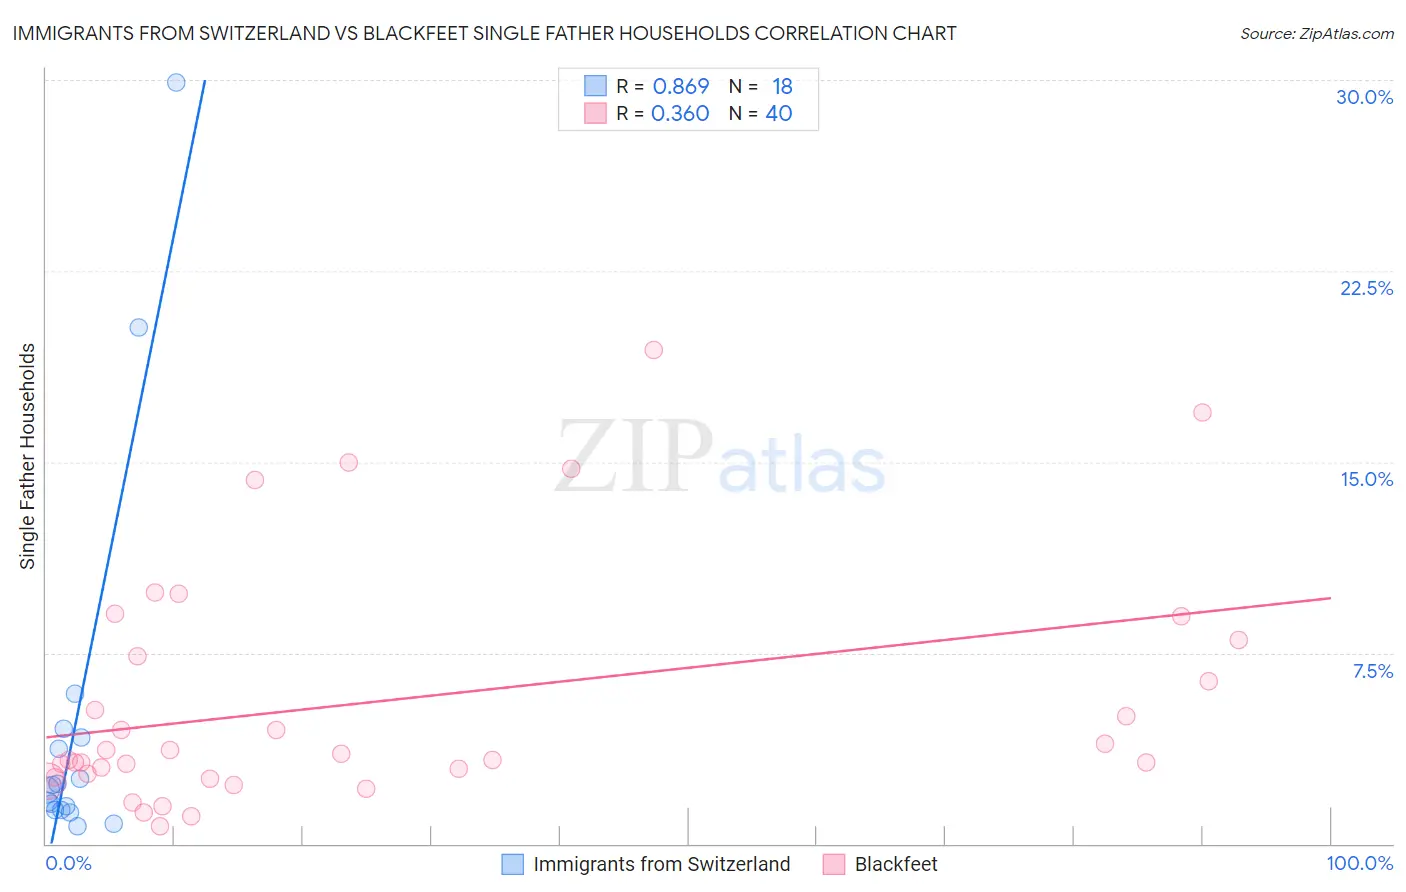
Immigrants from Switzerland vs Blackfeet Single Father Households Correlation Chart
The statistical analysis conducted on geographies consisting of 147,445,509 people shows a very strong positive correlation between the proportion of Immigrants from Switzerland and percentage of single father households in the United States with a correlation coefficient (R) of 0.869 and weighted average of 2.0%. Similarly, the statistical analysis conducted on geographies consisting of 307,723,942 people shows a mild positive correlation between the proportion of Blackfeet and percentage of single father households in the United States with a correlation coefficient (R) of 0.360 and weighted average of 2.7%, a difference of 34.0%.
Single Father Households Correlation Summary
| Measurement | Immigrants from Switzerland | Blackfeet |
| Minimum | 0.69% | 0.71% |
| Maximum | 29.9% | 19.4% |
| Range | 29.2% | 18.7% |
| Mean | 4.9% | 5.6% |
| Median | 2.2% | 3.4% |
| Interquartile 25% (IQ1) | 1.3% | 2.7% |
| Interquartile 75% (IQ3) | 4.2% | 7.7% |
| Interquartile Range (IQR) | 2.8% | 5.0% |
| Standard Deviation (Sample) | 7.7% | 4.7% |
| Standard Deviation (Population) | 7.4% | 4.6% |
Similar Demographics by Single Father Households
Demographics Similar to Immigrants from Switzerland by Single Father Households
In terms of single father households, the demographic groups most similar to Immigrants from Switzerland are Immigrants from Serbia (2.0%, a difference of 0.0%), Immigrants from Poland (2.0%, a difference of 0.0%), Immigrants from Kazakhstan (2.0%, a difference of 0.020%), Immigrants from Ukraine (2.0%, a difference of 0.040%), and Immigrants from Europe (2.0%, a difference of 0.24%).
| Demographics | Rating | Rank | Single Father Households |
| Immigrants | Grenada | 100.0 /100 | #43 | Exceptional 2.0% |
| Latvians | 100.0 /100 | #44 | Exceptional 2.0% |
| Russians | 100.0 /100 | #45 | Exceptional 2.0% |
| Immigrants | Lebanon | 100.0 /100 | #46 | Exceptional 2.0% |
| Immigrants | Ukraine | 99.9 /100 | #47 | Exceptional 2.0% |
| Immigrants | Kazakhstan | 99.9 /100 | #48 | Exceptional 2.0% |
| Immigrants | Serbia | 99.9 /100 | #49 | Exceptional 2.0% |
| Immigrants | Switzerland | 99.9 /100 | #50 | Exceptional 2.0% |
| Immigrants | Poland | 99.9 /100 | #51 | Exceptional 2.0% |
| Immigrants | Europe | 99.9 /100 | #52 | Exceptional 2.0% |
| Immigrants | Northern Europe | 99.9 /100 | #53 | Exceptional 2.0% |
| Immigrants | Korea | 99.9 /100 | #54 | Exceptional 2.0% |
| Immigrants | France | 99.9 /100 | #55 | Exceptional 2.0% |
| Immigrants | Norway | 99.9 /100 | #56 | Exceptional 2.0% |
| Burmese | 99.9 /100 | #57 | Exceptional 2.0% |
Demographics Similar to Blackfeet by Single Father Households
In terms of single father households, the demographic groups most similar to Blackfeet are Choctaw (2.7%, a difference of 0.46%), Puget Sound Salish (2.7%, a difference of 0.56%), Immigrants from Fiji (2.7%, a difference of 0.62%), Tlingit-Haida (2.7%, a difference of 1.0%), and Malaysian (2.7%, a difference of 1.1%).
| Demographics | Rating | Rank | Single Father Households |
| Hawaiians | 0.1 /100 | #284 | Tragic 2.7% |
| Ottawa | 0.1 /100 | #285 | Tragic 2.7% |
| Immigrants | Cuba | 0.1 /100 | #286 | Tragic 2.7% |
| Central American Indians | 0.0 /100 | #287 | Tragic 2.7% |
| Immigrants | Cambodia | 0.0 /100 | #288 | Tragic 2.7% |
| Tlingit-Haida | 0.0 /100 | #289 | Tragic 2.7% |
| Puget Sound Salish | 0.0 /100 | #290 | Tragic 2.7% |
| Blackfeet | 0.0 /100 | #291 | Tragic 2.7% |
| Choctaw | 0.0 /100 | #292 | Tragic 2.7% |
| Immigrants | Fiji | 0.0 /100 | #293 | Tragic 2.7% |
| Malaysians | 0.0 /100 | #294 | Tragic 2.7% |
| Chickasaw | 0.0 /100 | #295 | Tragic 2.8% |
| Japanese | 0.0 /100 | #296 | Tragic 2.8% |
| Hondurans | 0.0 /100 | #297 | Tragic 2.8% |
| Cree | 0.0 /100 | #298 | Tragic 2.8% |