Spaniard vs Blackfeet Single Father Households
COMPARE
Spaniard
Blackfeet
Single Father Households
Single Father Households Comparison
Spaniards
Blackfeet
2.5%
SINGLE FATHER HOUSEHOLDS
3.1/ 100
METRIC RATING
243rd/ 347
METRIC RANK
2.7%
SINGLE FATHER HOUSEHOLDS
0.0/ 100
METRIC RATING
291st/ 347
METRIC RANK
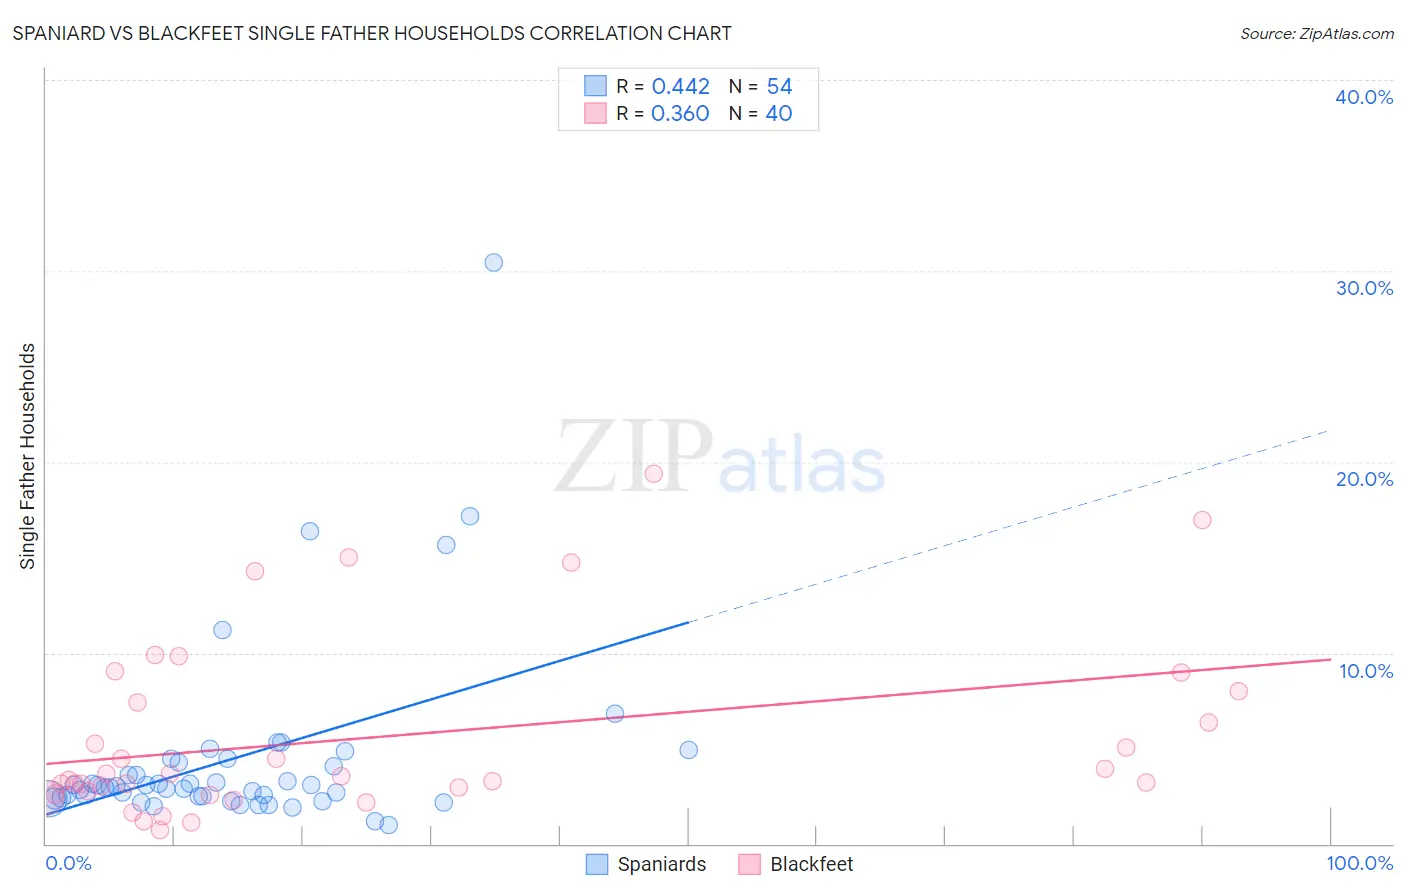
Spaniard vs Blackfeet Single Father Households Correlation Chart
The statistical analysis conducted on geographies consisting of 438,543,762 people shows a moderate positive correlation between the proportion of Spaniards and percentage of single father households in the United States with a correlation coefficient (R) of 0.442 and weighted average of 2.5%. Similarly, the statistical analysis conducted on geographies consisting of 307,723,942 people shows a mild positive correlation between the proportion of Blackfeet and percentage of single father households in the United States with a correlation coefficient (R) of 0.360 and weighted average of 2.7%, a difference of 8.7%.
Single Father Households Correlation Summary
| Measurement | Spaniard | Blackfeet |
| Minimum | 1.0% | 0.71% |
| Maximum | 30.4% | 19.4% |
| Range | 29.4% | 18.7% |
| Mean | 4.5% | 5.6% |
| Median | 3.0% | 3.4% |
| Interquartile 25% (IQ1) | 2.4% | 2.7% |
| Interquartile 75% (IQ3) | 4.2% | 7.7% |
| Interquartile Range (IQR) | 1.8% | 5.0% |
| Standard Deviation (Sample) | 5.0% | 4.7% |
| Standard Deviation (Population) | 4.9% | 4.6% |
Similar Demographics by Single Father Households
Demographics Similar to Spaniards by Single Father Households
In terms of single father households, the demographic groups most similar to Spaniards are Immigrants from Middle Africa (2.5%, a difference of 0.19%), Basque (2.5%, a difference of 0.39%), Native Hawaiian (2.5%, a difference of 0.41%), Delaware (2.5%, a difference of 0.43%), and Osage (2.5%, a difference of 0.46%).
| Demographics | Rating | Rank | Single Father Households |
| Cajuns | 6.1 /100 | #236 | Tragic 2.5% |
| Sierra Leoneans | 5.9 /100 | #237 | Tragic 2.5% |
| Immigrants | Sierra Leone | 5.8 /100 | #238 | Tragic 2.5% |
| Immigrants | Oceania | 5.8 /100 | #239 | Tragic 2.5% |
| Immigrants | Dominica | 4.8 /100 | #240 | Tragic 2.5% |
| Portuguese | 4.1 /100 | #241 | Tragic 2.5% |
| Osage | 4.1 /100 | #242 | Tragic 2.5% |
| Spaniards | 3.1 /100 | #243 | Tragic 2.5% |
| Immigrants | Middle Africa | 2.8 /100 | #244 | Tragic 2.5% |
| Basques | 2.5 /100 | #245 | Tragic 2.5% |
| Native Hawaiians | 2.5 /100 | #246 | Tragic 2.5% |
| Delaware | 2.5 /100 | #247 | Tragic 2.5% |
| Bahamians | 2.4 /100 | #248 | Tragic 2.5% |
| Immigrants | Cameroon | 2.3 /100 | #249 | Tragic 2.5% |
| Somalis | 2.1 /100 | #250 | Tragic 2.5% |
Demographics Similar to Blackfeet by Single Father Households
In terms of single father households, the demographic groups most similar to Blackfeet are Choctaw (2.7%, a difference of 0.46%), Puget Sound Salish (2.7%, a difference of 0.56%), Immigrants from Fiji (2.7%, a difference of 0.62%), Tlingit-Haida (2.7%, a difference of 1.0%), and Malaysian (2.7%, a difference of 1.1%).
| Demographics | Rating | Rank | Single Father Households |
| Hawaiians | 0.1 /100 | #284 | Tragic 2.7% |
| Ottawa | 0.1 /100 | #285 | Tragic 2.7% |
| Immigrants | Cuba | 0.1 /100 | #286 | Tragic 2.7% |
| Central American Indians | 0.0 /100 | #287 | Tragic 2.7% |
| Immigrants | Cambodia | 0.0 /100 | #288 | Tragic 2.7% |
| Tlingit-Haida | 0.0 /100 | #289 | Tragic 2.7% |
| Puget Sound Salish | 0.0 /100 | #290 | Tragic 2.7% |
| Blackfeet | 0.0 /100 | #291 | Tragic 2.7% |
| Choctaw | 0.0 /100 | #292 | Tragic 2.7% |
| Immigrants | Fiji | 0.0 /100 | #293 | Tragic 2.7% |
| Malaysians | 0.0 /100 | #294 | Tragic 2.7% |
| Chickasaw | 0.0 /100 | #295 | Tragic 2.8% |
| Japanese | 0.0 /100 | #296 | Tragic 2.8% |
| Hondurans | 0.0 /100 | #297 | Tragic 2.8% |
| Cree | 0.0 /100 | #298 | Tragic 2.8% |