Polish vs Immigrants from Sweden Family Households
COMPARE
Polish
Immigrants from Sweden
Family Households
Family Households Comparison
Poles
Immigrants from Sweden
64.0%
FAMILY HOUSEHOLDS
18.9/ 100
METRIC RATING
198th/ 347
METRIC RANK
62.5%
FAMILY HOUSEHOLDS
0.0/ 100
METRIC RATING
293rd/ 347
METRIC RANK
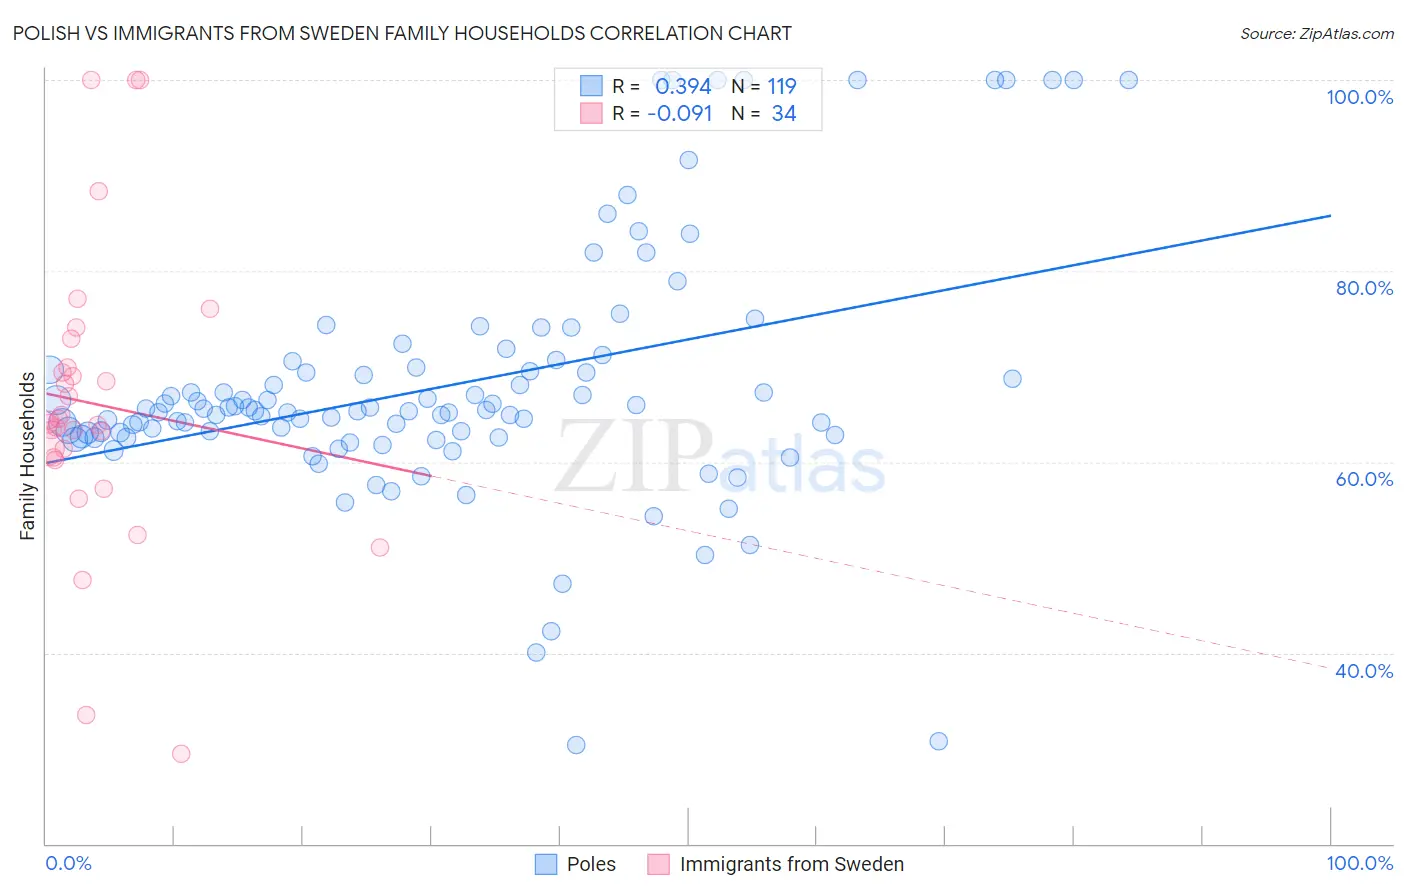
Polish vs Immigrants from Sweden Family Households Correlation Chart
The statistical analysis conducted on geographies consisting of 559,976,877 people shows a mild positive correlation between the proportion of Poles and percentage of family households in the United States with a correlation coefficient (R) of 0.394 and weighted average of 64.0%. Similarly, the statistical analysis conducted on geographies consisting of 164,705,416 people shows a slight negative correlation between the proportion of Immigrants from Sweden and percentage of family households in the United States with a correlation coefficient (R) of -0.091 and weighted average of 62.5%, a difference of 2.4%.
Family Households Correlation Summary
| Measurement | Polish | Immigrants from Sweden |
| Minimum | 30.3% | 29.4% |
| Maximum | 100.0% | 100.0% |
| Range | 69.7% | 70.6% |
| Mean | 68.0% | 66.1% |
| Median | 65.4% | 64.2% |
| Interquartile 25% (IQ1) | 62.7% | 60.5% |
| Interquartile 75% (IQ3) | 69.9% | 69.9% |
| Interquartile Range (IQR) | 7.2% | 9.4% |
| Standard Deviation (Sample) | 13.1% | 15.4% |
| Standard Deviation (Population) | 13.1% | 15.2% |
Similar Demographics by Family Households
Demographics Similar to Poles by Family Households
In terms of family households, the demographic groups most similar to Poles are Seminole (64.0%, a difference of 0.0%), Immigrants from Canada (64.0%, a difference of 0.010%), Slavic (64.0%, a difference of 0.010%), Immigrants from North America (64.0%, a difference of 0.020%), and Immigrants from Malaysia (64.0%, a difference of 0.020%).
| Demographics | Rating | Rank | Family Households |
| Arabs | 24.5 /100 | #191 | Fair 64.1% |
| Lithuanians | 23.8 /100 | #192 | Fair 64.0% |
| French | 23.7 /100 | #193 | Fair 64.0% |
| Paiute | 22.2 /100 | #194 | Fair 64.0% |
| Immigrants | North America | 20.0 /100 | #195 | Poor 64.0% |
| Immigrants | Canada | 19.2 /100 | #196 | Poor 64.0% |
| Seminole | 18.9 /100 | #197 | Poor 64.0% |
| Poles | 18.9 /100 | #198 | Poor 64.0% |
| Slavs | 18.6 /100 | #199 | Poor 64.0% |
| Immigrants | Malaysia | 17.9 /100 | #200 | Poor 64.0% |
| Immigrants | Eastern Europe | 17.2 /100 | #201 | Poor 64.0% |
| Iranians | 13.5 /100 | #202 | Poor 63.9% |
| Norwegians | 13.2 /100 | #203 | Poor 63.9% |
| Immigrants | Uruguay | 12.8 /100 | #204 | Poor 63.9% |
| Brazilians | 12.4 /100 | #205 | Poor 63.9% |
Demographics Similar to Immigrants from Sweden by Family Households
In terms of family households, the demographic groups most similar to Immigrants from Sweden are Barbadian (62.5%, a difference of 0.060%), Okinawan (62.5%, a difference of 0.080%), Slovene (62.4%, a difference of 0.090%), French American Indian (62.4%, a difference of 0.10%), and Immigrants from Burma/Myanmar (62.6%, a difference of 0.13%).
| Demographics | Rating | Rank | Family Households |
| British West Indians | 0.1 /100 | #286 | Tragic 62.8% |
| Latvians | 0.1 /100 | #287 | Tragic 62.8% |
| Immigrants | Uganda | 0.1 /100 | #288 | Tragic 62.7% |
| Immigrants | Nepal | 0.1 /100 | #289 | Tragic 62.7% |
| Immigrants | Grenada | 0.0 /100 | #290 | Tragic 62.6% |
| U.S. Virgin Islanders | 0.0 /100 | #291 | Tragic 62.6% |
| Immigrants | Burma/Myanmar | 0.0 /100 | #292 | Tragic 62.6% |
| Immigrants | Sweden | 0.0 /100 | #293 | Tragic 62.5% |
| Barbadians | 0.0 /100 | #294 | Tragic 62.5% |
| Okinawans | 0.0 /100 | #295 | Tragic 62.5% |
| Slovenes | 0.0 /100 | #296 | Tragic 62.4% |
| French American Indians | 0.0 /100 | #297 | Tragic 62.4% |
| Immigrants | Spain | 0.0 /100 | #298 | Tragic 62.4% |
| Immigrants | Kuwait | 0.0 /100 | #299 | Tragic 62.4% |
| Immigrants | Africa | 0.0 /100 | #300 | Tragic 62.4% |