German vs Portuguese Family Households
COMPARE
German
Portuguese
Family Households
Family Households Comparison
Germans
Portuguese
64.4%
FAMILY HOUSEHOLDS
65.8/ 100
METRIC RATING
159th/ 347
METRIC RANK
65.8%
FAMILY HOUSEHOLDS
99.9/ 100
METRIC RATING
72nd/ 347
METRIC RANK
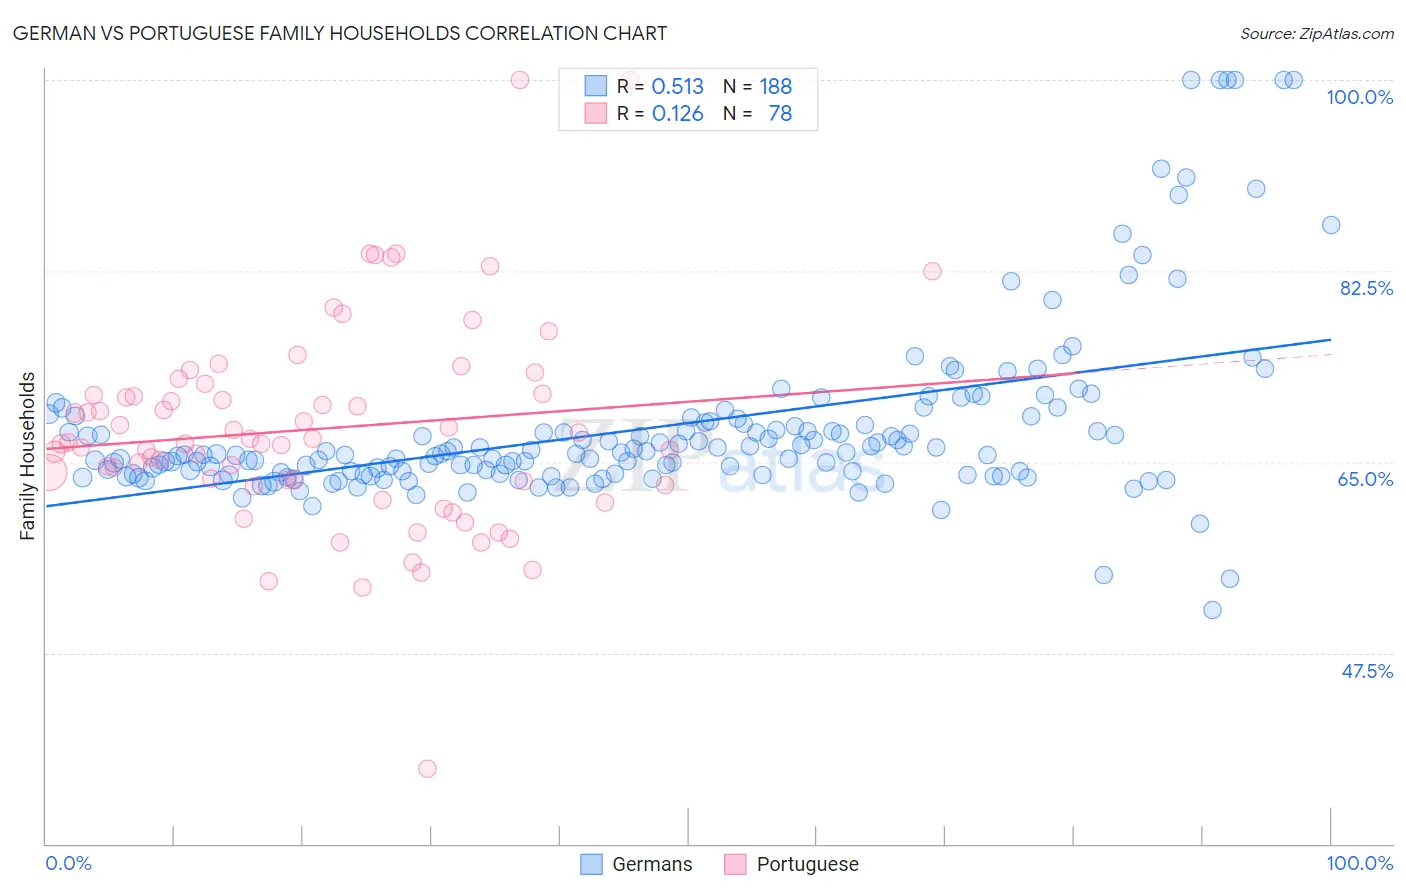
German vs Portuguese Family Households Correlation Chart
The statistical analysis conducted on geographies consisting of 580,609,417 people shows a substantial positive correlation between the proportion of Germans and percentage of family households in the United States with a correlation coefficient (R) of 0.513 and weighted average of 64.4%. Similarly, the statistical analysis conducted on geographies consisting of 449,986,685 people shows a poor positive correlation between the proportion of Portuguese and percentage of family households in the United States with a correlation coefficient (R) of 0.126 and weighted average of 65.8%, a difference of 2.1%.
Family Households Correlation Summary
| Measurement | German | Portuguese |
| Minimum | 51.4% | 36.8% |
| Maximum | 100.0% | 100.0% |
| Range | 48.6% | 63.2% |
| Mean | 68.1% | 68.0% |
| Median | 65.7% | 66.8% |
| Interquartile 25% (IQ1) | 63.9% | 63.3% |
| Interquartile 75% (IQ3) | 68.5% | 71.2% |
| Interquartile Range (IQR) | 4.7% | 8.0% |
| Standard Deviation (Sample) | 8.2% | 9.6% |
| Standard Deviation (Population) | 8.2% | 9.6% |
Similar Demographics by Family Households
Demographics Similar to Germans by Family Households
In terms of family households, the demographic groups most similar to Germans are Canadian (64.4%, a difference of 0.010%), Lebanese (64.4%, a difference of 0.010%), Immigrants from Moldova (64.4%, a difference of 0.010%), Czech (64.5%, a difference of 0.020%), and Uruguayan (64.5%, a difference of 0.030%).
| Demographics | Rating | Rank | Family Households |
| Scottish | 70.9 /100 | #152 | Good 64.5% |
| Swedes | 69.8 /100 | #153 | Good 64.5% |
| Austrians | 68.5 /100 | #154 | Good 64.5% |
| Uruguayans | 67.7 /100 | #155 | Good 64.5% |
| Czechs | 67.0 /100 | #156 | Good 64.5% |
| Canadians | 66.6 /100 | #157 | Good 64.4% |
| Lebanese | 66.4 /100 | #158 | Good 64.4% |
| Germans | 65.8 /100 | #159 | Good 64.4% |
| Immigrants | Moldova | 65.2 /100 | #160 | Good 64.4% |
| Immigrants | England | 62.6 /100 | #161 | Good 64.4% |
| British | 61.6 /100 | #162 | Good 64.4% |
| Chickasaw | 61.5 /100 | #163 | Good 64.4% |
| Immigrants | Nigeria | 60.1 /100 | #164 | Good 64.4% |
| Immigrants | Southern Europe | 60.0 /100 | #165 | Good 64.4% |
| Scotch-Irish | 59.2 /100 | #166 | Average 64.4% |
Demographics Similar to Portuguese by Family Households
In terms of family households, the demographic groups most similar to Portuguese are Bhutanese (65.9%, a difference of 0.050%), Immigrants from Afghanistan (65.9%, a difference of 0.070%), Malaysian (65.9%, a difference of 0.080%), Laotian (65.8%, a difference of 0.080%), and Japanese (65.9%, a difference of 0.11%).
| Demographics | Rating | Rank | Family Households |
| Costa Ricans | 99.9 /100 | #65 | Exceptional 65.9% |
| Fijians | 99.9 /100 | #66 | Exceptional 65.9% |
| Filipinos | 99.9 /100 | #67 | Exceptional 65.9% |
| Japanese | 99.9 /100 | #68 | Exceptional 65.9% |
| Malaysians | 99.9 /100 | #69 | Exceptional 65.9% |
| Immigrants | Afghanistan | 99.9 /100 | #70 | Exceptional 65.9% |
| Bhutanese | 99.9 /100 | #71 | Exceptional 65.9% |
| Portuguese | 99.9 /100 | #72 | Exceptional 65.8% |
| Laotians | 99.9 /100 | #73 | Exceptional 65.8% |
| Burmese | 99.9 /100 | #74 | Exceptional 65.7% |
| Houma | 99.9 /100 | #75 | Exceptional 65.7% |
| Immigrants | Azores | 99.8 /100 | #76 | Exceptional 65.6% |
| Immigrants | South America | 99.8 /100 | #77 | Exceptional 65.6% |
| Yaqui | 99.8 /100 | #78 | Exceptional 65.6% |
| Immigrants | Costa Rica | 99.8 /100 | #79 | Exceptional 65.6% |