German vs Haitian Family Households
COMPARE
German
Haitian
Family Households
Family Households Comparison
Germans
Haitians
64.4%
FAMILY HOUSEHOLDS
65.8/ 100
METRIC RATING
159th/ 347
METRIC RANK
65.2%
FAMILY HOUSEHOLDS
98.1/ 100
METRIC RATING
100th/ 347
METRIC RANK
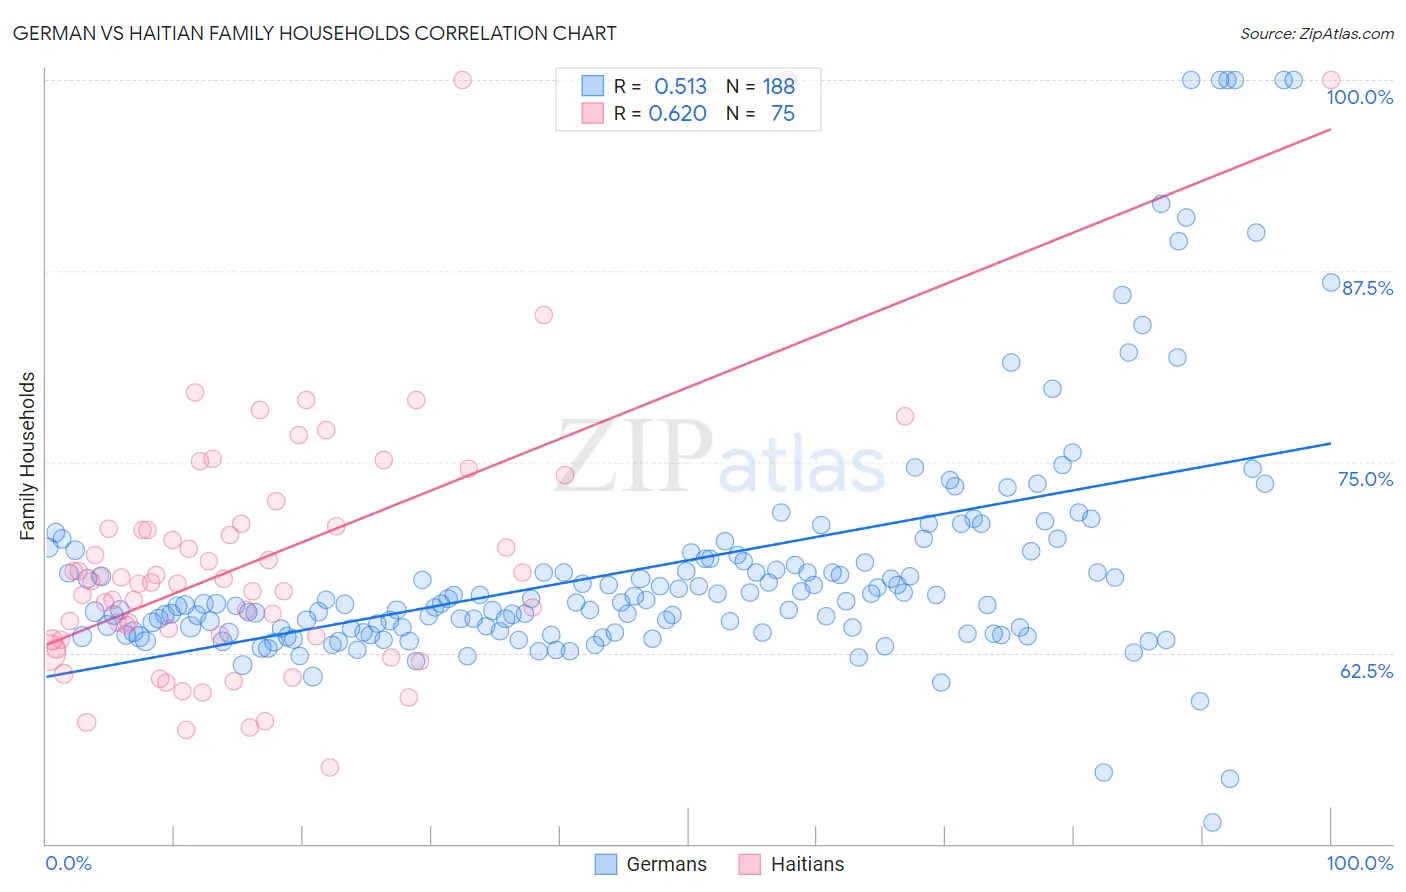
German vs Haitian Family Households Correlation Chart
The statistical analysis conducted on geographies consisting of 580,609,417 people shows a substantial positive correlation between the proportion of Germans and percentage of family households in the United States with a correlation coefficient (R) of 0.513 and weighted average of 64.4%. Similarly, the statistical analysis conducted on geographies consisting of 287,715,427 people shows a significant positive correlation between the proportion of Haitians and percentage of family households in the United States with a correlation coefficient (R) of 0.620 and weighted average of 65.2%, a difference of 1.1%.
Family Households Correlation Summary
| Measurement | German | Haitian |
| Minimum | 51.4% | 55.0% |
| Maximum | 100.0% | 100.0% |
| Range | 48.6% | 45.0% |
| Mean | 68.1% | 68.6% |
| Median | 65.7% | 67.1% |
| Interquartile 25% (IQ1) | 63.9% | 63.4% |
| Interquartile 75% (IQ3) | 68.5% | 70.8% |
| Interquartile Range (IQR) | 4.7% | 7.4% |
| Standard Deviation (Sample) | 8.2% | 8.8% |
| Standard Deviation (Population) | 8.2% | 8.7% |
Similar Demographics by Family Households
Demographics Similar to Germans by Family Households
In terms of family households, the demographic groups most similar to Germans are Canadian (64.4%, a difference of 0.010%), Lebanese (64.4%, a difference of 0.010%), Immigrants from Moldova (64.4%, a difference of 0.010%), Czech (64.5%, a difference of 0.020%), and Uruguayan (64.5%, a difference of 0.030%).
| Demographics | Rating | Rank | Family Households |
| Scottish | 70.9 /100 | #152 | Good 64.5% |
| Swedes | 69.8 /100 | #153 | Good 64.5% |
| Austrians | 68.5 /100 | #154 | Good 64.5% |
| Uruguayans | 67.7 /100 | #155 | Good 64.5% |
| Czechs | 67.0 /100 | #156 | Good 64.5% |
| Canadians | 66.6 /100 | #157 | Good 64.4% |
| Lebanese | 66.4 /100 | #158 | Good 64.4% |
| Germans | 65.8 /100 | #159 | Good 64.4% |
| Immigrants | Moldova | 65.2 /100 | #160 | Good 64.4% |
| Immigrants | England | 62.6 /100 | #161 | Good 64.4% |
| British | 61.6 /100 | #162 | Good 64.4% |
| Chickasaw | 61.5 /100 | #163 | Good 64.4% |
| Immigrants | Nigeria | 60.1 /100 | #164 | Good 64.4% |
| Immigrants | Southern Europe | 60.0 /100 | #165 | Good 64.4% |
| Scotch-Irish | 59.2 /100 | #166 | Average 64.4% |
Demographics Similar to Haitians by Family Households
In terms of family households, the demographic groups most similar to Haitians are Chilean (65.2%, a difference of 0.0%), Immigrants from Sri Lanka (65.1%, a difference of 0.020%), Central American Indian (65.2%, a difference of 0.040%), Indian (Asian) (65.1%, a difference of 0.040%), and Spaniard (65.1%, a difference of 0.040%).
| Demographics | Rating | Rank | Family Households |
| Guyanese | 98.8 /100 | #93 | Exceptional 65.3% |
| Immigrants | Poland | 98.7 /100 | #94 | Exceptional 65.2% |
| Immigrants | Portugal | 98.6 /100 | #95 | Exceptional 65.2% |
| Swiss | 98.6 /100 | #96 | Exceptional 65.2% |
| Guatemalans | 98.6 /100 | #97 | Exceptional 65.2% |
| Immigrants | Syria | 98.4 /100 | #98 | Exceptional 65.2% |
| Central American Indians | 98.3 /100 | #99 | Exceptional 65.2% |
| Haitians | 98.1 /100 | #100 | Exceptional 65.2% |
| Chileans | 98.1 /100 | #101 | Exceptional 65.2% |
| Immigrants | Sri Lanka | 98.0 /100 | #102 | Exceptional 65.1% |
| Indians (Asian) | 97.9 /100 | #103 | Exceptional 65.1% |
| Spaniards | 97.8 /100 | #104 | Exceptional 65.1% |
| English | 97.4 /100 | #105 | Exceptional 65.1% |
| Whites/Caucasians | 97.3 /100 | #106 | Exceptional 65.1% |
| Alaska Natives | 97.3 /100 | #107 | Exceptional 65.1% |