German vs Portuguese 10th Grade
COMPARE
German
Portuguese
10th Grade
10th Grade Comparison
Germans
Portuguese
95.8%
10TH GRADE
100.0/ 100
METRIC RATING
7th/ 347
METRIC RANK
93.3%
10TH GRADE
12.1/ 100
METRIC RATING
217th/ 347
METRIC RANK
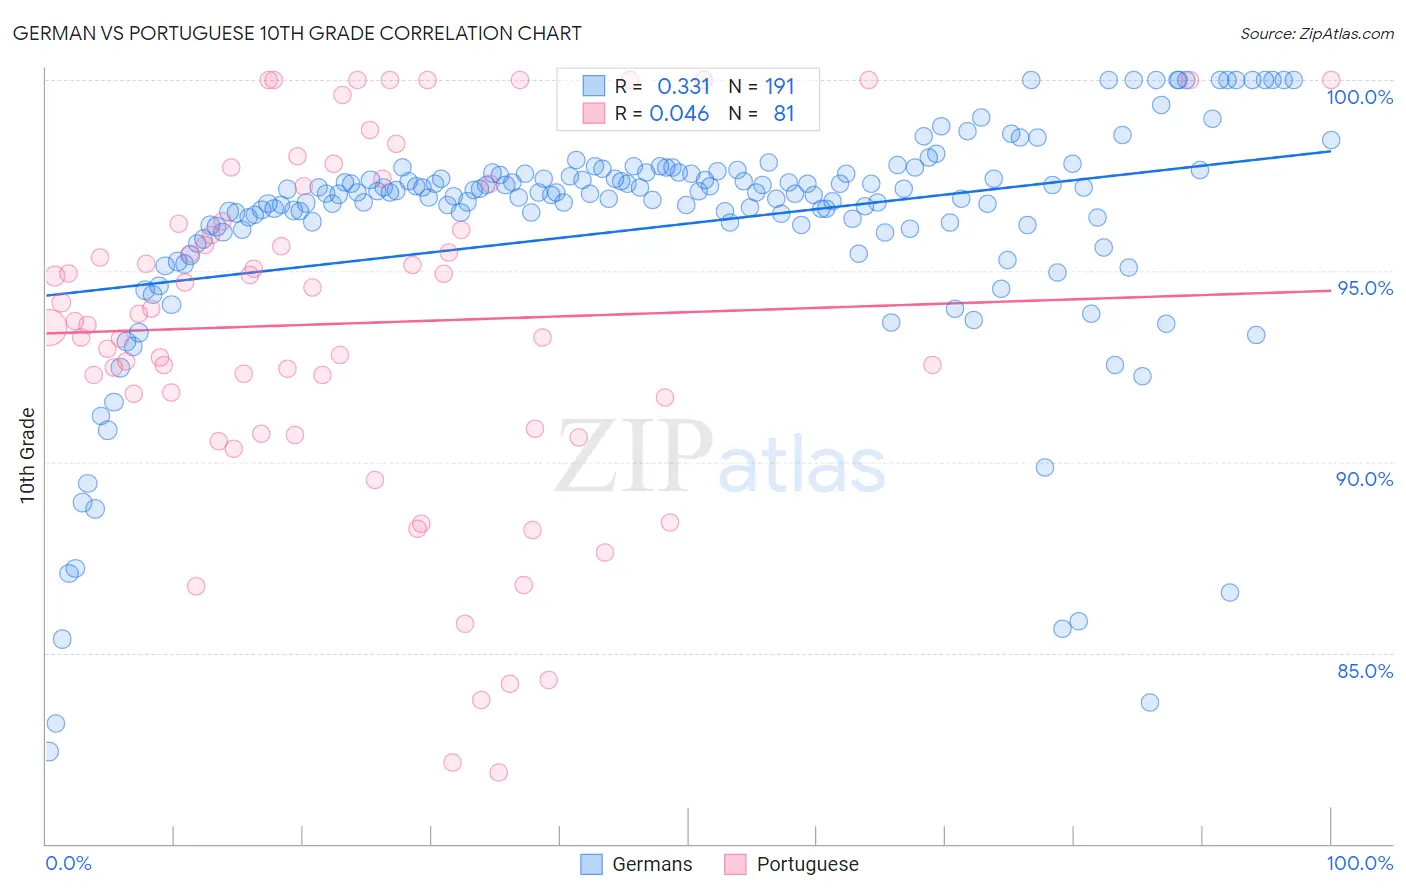
German vs Portuguese 10th Grade Correlation Chart
The statistical analysis conducted on geographies consisting of 581,302,287 people shows a mild positive correlation between the proportion of Germans and percentage of population with at least 10th grade education in the United States with a correlation coefficient (R) of 0.331 and weighted average of 95.8%. Similarly, the statistical analysis conducted on geographies consisting of 450,343,001 people shows no correlation between the proportion of Portuguese and percentage of population with at least 10th grade education in the United States with a correlation coefficient (R) of 0.046 and weighted average of 93.3%, a difference of 2.7%.
10th Grade Correlation Summary
| Measurement | German | Portuguese |
| Minimum | 82.4% | 81.9% |
| Maximum | 100.0% | 100.0% |
| Range | 17.6% | 18.1% |
| Mean | 96.2% | 93.6% |
| Median | 97.0% | 93.9% |
| Interquartile 25% (IQ1) | 96.1% | 91.3% |
| Interquartile 75% (IQ3) | 97.5% | 96.8% |
| Interquartile Range (IQR) | 1.4% | 5.5% |
| Standard Deviation (Sample) | 3.2% | 4.5% |
| Standard Deviation (Population) | 3.2% | 4.5% |
Similar Demographics by 10th Grade
Demographics Similar to Germans by 10th Grade
In terms of 10th grade, the demographic groups most similar to Germans are Polish (95.8%, a difference of 0.010%), Lithuanian (95.8%, a difference of 0.010%), Finnish (95.8%, a difference of 0.070%), Croatian (95.7%, a difference of 0.090%), and Carpatho Rusyn (95.9%, a difference of 0.11%).
| Demographics | Rating | Rank | 10th Grade |
| Norwegians | 100.0 /100 | #1 | Exceptional 96.2% |
| Slovaks | 100.0 /100 | #2 | Exceptional 96.0% |
| Slovenes | 100.0 /100 | #3 | Exceptional 95.9% |
| Swedes | 100.0 /100 | #4 | Exceptional 95.9% |
| Carpatho Rusyns | 100.0 /100 | #5 | Exceptional 95.9% |
| Poles | 100.0 /100 | #6 | Exceptional 95.8% |
| Germans | 100.0 /100 | #7 | Exceptional 95.8% |
| Lithuanians | 100.0 /100 | #8 | Exceptional 95.8% |
| Finns | 100.0 /100 | #9 | Exceptional 95.8% |
| Croatians | 100.0 /100 | #10 | Exceptional 95.7% |
| Danes | 100.0 /100 | #11 | Exceptional 95.7% |
| Tlingit-Haida | 100.0 /100 | #12 | Exceptional 95.7% |
| English | 100.0 /100 | #13 | Exceptional 95.6% |
| Tsimshian | 100.0 /100 | #14 | Exceptional 95.6% |
| Irish | 100.0 /100 | #15 | Exceptional 95.6% |
Demographics Similar to Portuguese by 10th Grade
In terms of 10th grade, the demographic groups most similar to Portuguese are Immigrants from Liberia (93.3%, a difference of 0.040%), Seminole (93.3%, a difference of 0.040%), Immigrants from Eastern Africa (93.4%, a difference of 0.050%), Immigrants from Bahamas (93.4%, a difference of 0.060%), and Immigrants from Oceania (93.4%, a difference of 0.060%).
| Demographics | Rating | Rank | 10th Grade |
| Indians (Asian) | 17.6 /100 | #210 | Poor 93.4% |
| Cajuns | 16.9 /100 | #211 | Poor 93.4% |
| Immigrants | Zaire | 16.7 /100 | #212 | Poor 93.4% |
| Immigrants | Asia | 15.7 /100 | #213 | Poor 93.4% |
| Immigrants | Bahamas | 15.2 /100 | #214 | Poor 93.4% |
| Immigrants | Oceania | 15.1 /100 | #215 | Poor 93.4% |
| Immigrants | Eastern Africa | 14.7 /100 | #216 | Poor 93.4% |
| Portuguese | 12.1 /100 | #217 | Poor 93.3% |
| Immigrants | Liberia | 10.2 /100 | #218 | Poor 93.3% |
| Seminole | 10.2 /100 | #219 | Poor 93.3% |
| Tongans | 9.5 /100 | #220 | Tragic 93.3% |
| Immigrants | Southern Europe | 8.9 /100 | #221 | Tragic 93.2% |
| Ethiopians | 7.9 /100 | #222 | Tragic 93.2% |
| Immigrants | Sierra Leone | 7.6 /100 | #223 | Tragic 93.2% |
| Bolivians | 6.7 /100 | #224 | Tragic 93.2% |