Colombian vs Portuguese Family Households
COMPARE
Colombian
Portuguese
Family Households
Family Households Comparison
Colombians
Portuguese
66.3%
FAMILY HOUSEHOLDS
100.0/ 100
METRIC RATING
52nd/ 347
METRIC RANK
65.8%
FAMILY HOUSEHOLDS
99.9/ 100
METRIC RATING
72nd/ 347
METRIC RANK
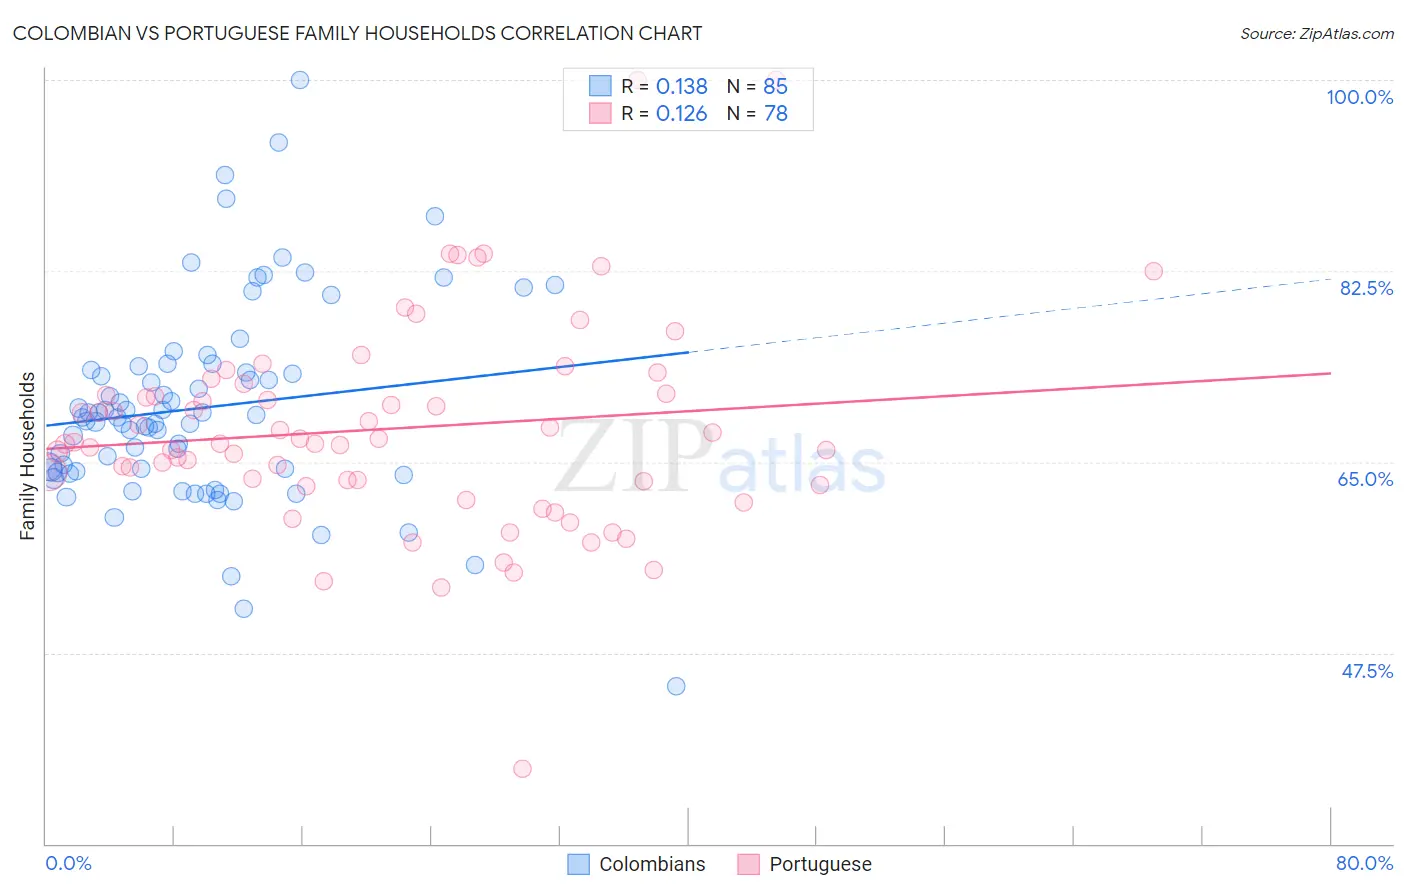
Colombian vs Portuguese Family Households Correlation Chart
The statistical analysis conducted on geographies consisting of 419,324,434 people shows a poor positive correlation between the proportion of Colombians and percentage of family households in the United States with a correlation coefficient (R) of 0.138 and weighted average of 66.3%. Similarly, the statistical analysis conducted on geographies consisting of 449,986,685 people shows a poor positive correlation between the proportion of Portuguese and percentage of family households in the United States with a correlation coefficient (R) of 0.126 and weighted average of 65.8%, a difference of 0.67%.
Family Households Correlation Summary
| Measurement | Colombian | Portuguese |
| Minimum | 44.4% | 36.8% |
| Maximum | 100.0% | 100.0% |
| Range | 55.6% | 63.2% |
| Mean | 70.0% | 68.0% |
| Median | 69.1% | 66.8% |
| Interquartile 25% (IQ1) | 64.1% | 63.3% |
| Interquartile 75% (IQ3) | 73.6% | 71.2% |
| Interquartile Range (IQR) | 9.5% | 8.0% |
| Standard Deviation (Sample) | 9.2% | 9.6% |
| Standard Deviation (Population) | 9.2% | 9.6% |
Demographics Similar to Colombians and Portuguese by Family Households
In terms of family households, the demographic groups most similar to Colombians are Afghan (66.3%, a difference of 0.010%), Immigrants from Colombia (66.3%, a difference of 0.010%), Immigrants (66.1%, a difference of 0.17%), Immigrants from Hong Kong (66.1%, a difference of 0.18%), and Pennsylvania German (66.1%, a difference of 0.20%). Similarly, the demographic groups most similar to Portuguese are Bhutanese (65.9%, a difference of 0.050%), Immigrants from Afghanistan (65.9%, a difference of 0.070%), Malaysian (65.9%, a difference of 0.080%), Japanese (65.9%, a difference of 0.11%), and Fijian (65.9%, a difference of 0.13%).
| Demographics | Rating | Rank | Family Households |
| Colombians | 100.0 /100 | #52 | Exceptional 66.3% |
| Afghans | 100.0 /100 | #53 | Exceptional 66.3% |
| Immigrants | Colombia | 100.0 /100 | #54 | Exceptional 66.3% |
| Immigrants | Immigrants | 100.0 /100 | #55 | Exceptional 66.1% |
| Immigrants | Hong Kong | 100.0 /100 | #56 | Exceptional 66.1% |
| Pennsylvania Germans | 100.0 /100 | #57 | Exceptional 66.1% |
| Immigrants | Asia | 100.0 /100 | #58 | Exceptional 66.1% |
| Immigrants | Korea | 100.0 /100 | #59 | Exceptional 66.0% |
| South Americans | 100.0 /100 | #60 | Exceptional 66.0% |
| Danes | 100.0 /100 | #61 | Exceptional 66.0% |
| Central Americans | 100.0 /100 | #62 | Exceptional 66.0% |
| Immigrants | Indonesia | 100.0 /100 | #63 | Exceptional 66.0% |
| Pima | 99.9 /100 | #64 | Exceptional 65.9% |
| Costa Ricans | 99.9 /100 | #65 | Exceptional 65.9% |
| Fijians | 99.9 /100 | #66 | Exceptional 65.9% |
| Filipinos | 99.9 /100 | #67 | Exceptional 65.9% |
| Japanese | 99.9 /100 | #68 | Exceptional 65.9% |
| Malaysians | 99.9 /100 | #69 | Exceptional 65.9% |
| Immigrants | Afghanistan | 99.9 /100 | #70 | Exceptional 65.9% |
| Bhutanese | 99.9 /100 | #71 | Exceptional 65.9% |
| Portuguese | 99.9 /100 | #72 | Exceptional 65.8% |