German vs Immigrants from Cameroon No Vehicles in Household
COMPARE
German
Immigrants from Cameroon
No Vehicles in Household
No Vehicles in Household Comparison
Germans
Immigrants from Cameroon
6.7%
NO VEHICLES IN HOUSEHOLD
100.0/ 100
METRIC RATING
6th/ 347
METRIC RANK
9.6%
NO VEHICLES IN HOUSEHOLD
90.6/ 100
METRIC RATING
125th/ 347
METRIC RANK
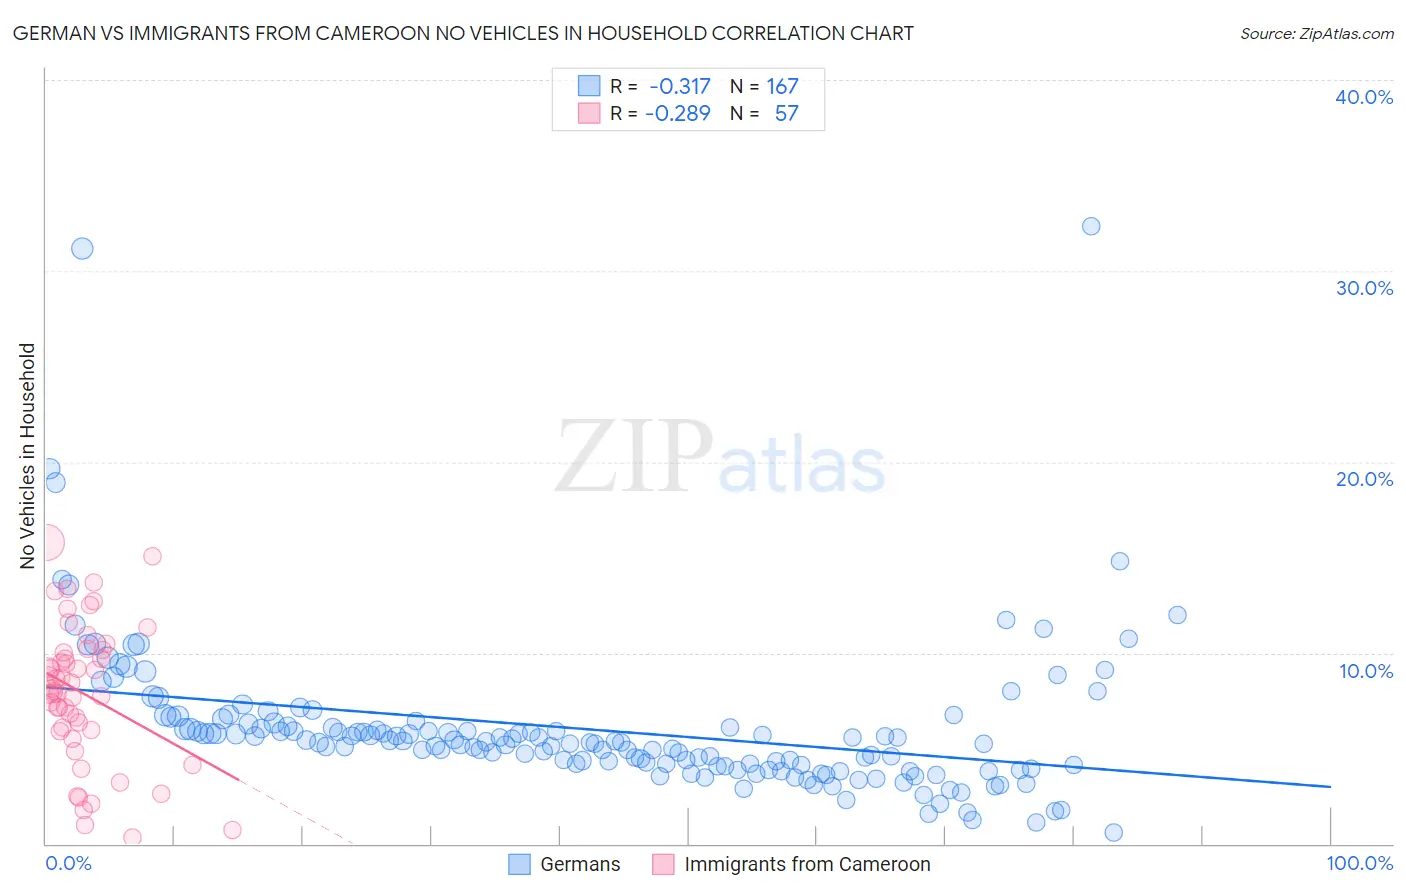
German vs Immigrants from Cameroon No Vehicles in Household Correlation Chart
The statistical analysis conducted on geographies consisting of 573,819,115 people shows a mild negative correlation between the proportion of Germans and percentage of households with no vehicle available in the United States with a correlation coefficient (R) of -0.317 and weighted average of 6.7%. Similarly, the statistical analysis conducted on geographies consisting of 130,622,136 people shows a weak negative correlation between the proportion of Immigrants from Cameroon and percentage of households with no vehicle available in the United States with a correlation coefficient (R) of -0.289 and weighted average of 9.6%, a difference of 43.9%.
No Vehicles in Household Correlation Summary
| Measurement | German | Immigrants from Cameroon |
| Minimum | 0.56% | 0.36% |
| Maximum | 32.3% | 15.8% |
| Range | 31.8% | 15.4% |
| Mean | 6.0% | 7.9% |
| Median | 5.3% | 8.0% |
| Interquartile 25% (IQ1) | 4.1% | 5.9% |
| Interquartile 75% (IQ3) | 6.1% | 10.1% |
| Interquartile Range (IQR) | 2.0% | 4.1% |
| Standard Deviation (Sample) | 4.0% | 3.6% |
| Standard Deviation (Population) | 4.0% | 3.6% |
Similar Demographics by No Vehicles in Household
Demographics Similar to Germans by No Vehicles in Household
In terms of no vehicles in household, the demographic groups most similar to Germans are Yakama (6.6%, a difference of 0.99%), Scottish (6.8%, a difference of 1.3%), Danish (6.6%, a difference of 1.3%), Swedish (6.8%, a difference of 1.8%), and Scotch-Irish (6.8%, a difference of 2.0%).
| Demographics | Rating | Rank | No Vehicles in Household |
| Luxembourgers | 100.0 /100 | #1 | Exceptional 5.4% |
| Norwegians | 100.0 /100 | #2 | Exceptional 6.4% |
| English | 100.0 /100 | #3 | Exceptional 6.5% |
| Danes | 100.0 /100 | #4 | Exceptional 6.6% |
| Yakama | 100.0 /100 | #5 | Exceptional 6.6% |
| Germans | 100.0 /100 | #6 | Exceptional 6.7% |
| Scottish | 100.0 /100 | #7 | Exceptional 6.8% |
| Swedes | 100.0 /100 | #8 | Exceptional 6.8% |
| Scotch-Irish | 100.0 /100 | #9 | Exceptional 6.8% |
| Dutch | 100.0 /100 | #10 | Exceptional 6.8% |
| Czechs | 100.0 /100 | #11 | Exceptional 6.9% |
| Assyrians/Chaldeans/Syriacs | 100.0 /100 | #12 | Exceptional 7.0% |
| Scandinavians | 100.0 /100 | #13 | Exceptional 7.0% |
| Mexicans | 100.0 /100 | #14 | Exceptional 7.0% |
| Whites/Caucasians | 100.0 /100 | #15 | Exceptional 7.0% |
Demographics Similar to Immigrants from Cameroon by No Vehicles in Household
In terms of no vehicles in household, the demographic groups most similar to Immigrants from Cameroon are Immigrants from Korea (9.6%, a difference of 0.13%), Icelander (9.6%, a difference of 0.17%), Immigrants from Kenya (9.6%, a difference of 0.35%), Blackfeet (9.6%, a difference of 0.36%), and Immigrants from Syria (9.6%, a difference of 0.43%).
| Demographics | Rating | Rank | No Vehicles in Household |
| Greeks | 92.9 /100 | #118 | Exceptional 9.5% |
| Fijians | 92.7 /100 | #119 | Exceptional 9.5% |
| Immigrants | Thailand | 92.6 /100 | #120 | Exceptional 9.5% |
| Puget Sound Salish | 92.4 /100 | #121 | Exceptional 9.5% |
| Costa Ricans | 92.3 /100 | #122 | Exceptional 9.5% |
| Blackfeet | 91.4 /100 | #123 | Exceptional 9.6% |
| Immigrants | Korea | 90.9 /100 | #124 | Exceptional 9.6% |
| Immigrants | Cameroon | 90.6 /100 | #125 | Exceptional 9.6% |
| Icelanders | 90.2 /100 | #126 | Exceptional 9.6% |
| Immigrants | Kenya | 89.7 /100 | #127 | Excellent 9.6% |
| Immigrants | Syria | 89.5 /100 | #128 | Excellent 9.6% |
| Nicaraguans | 89.5 /100 | #129 | Excellent 9.7% |
| Burmese | 88.8 /100 | #130 | Excellent 9.7% |
| Immigrants | Azores | 88.2 /100 | #131 | Excellent 9.7% |
| Kenyans | 88.0 /100 | #132 | Excellent 9.7% |