German vs Immigrants from Cameroon Householder Income Under 25 years
COMPARE
German
Immigrants from Cameroon
Householder Income Under 25 years
Householder Income Under 25 years Comparison
Germans
Immigrants from Cameroon
$50,804
HOUSEHOLDER INCOME UNDER 25 YEARS
3.3/ 100
METRIC RATING
237th/ 347
METRIC RANK
$51,433
HOUSEHOLDER INCOME UNDER 25 YEARS
13.6/ 100
METRIC RATING
203rd/ 347
METRIC RANK
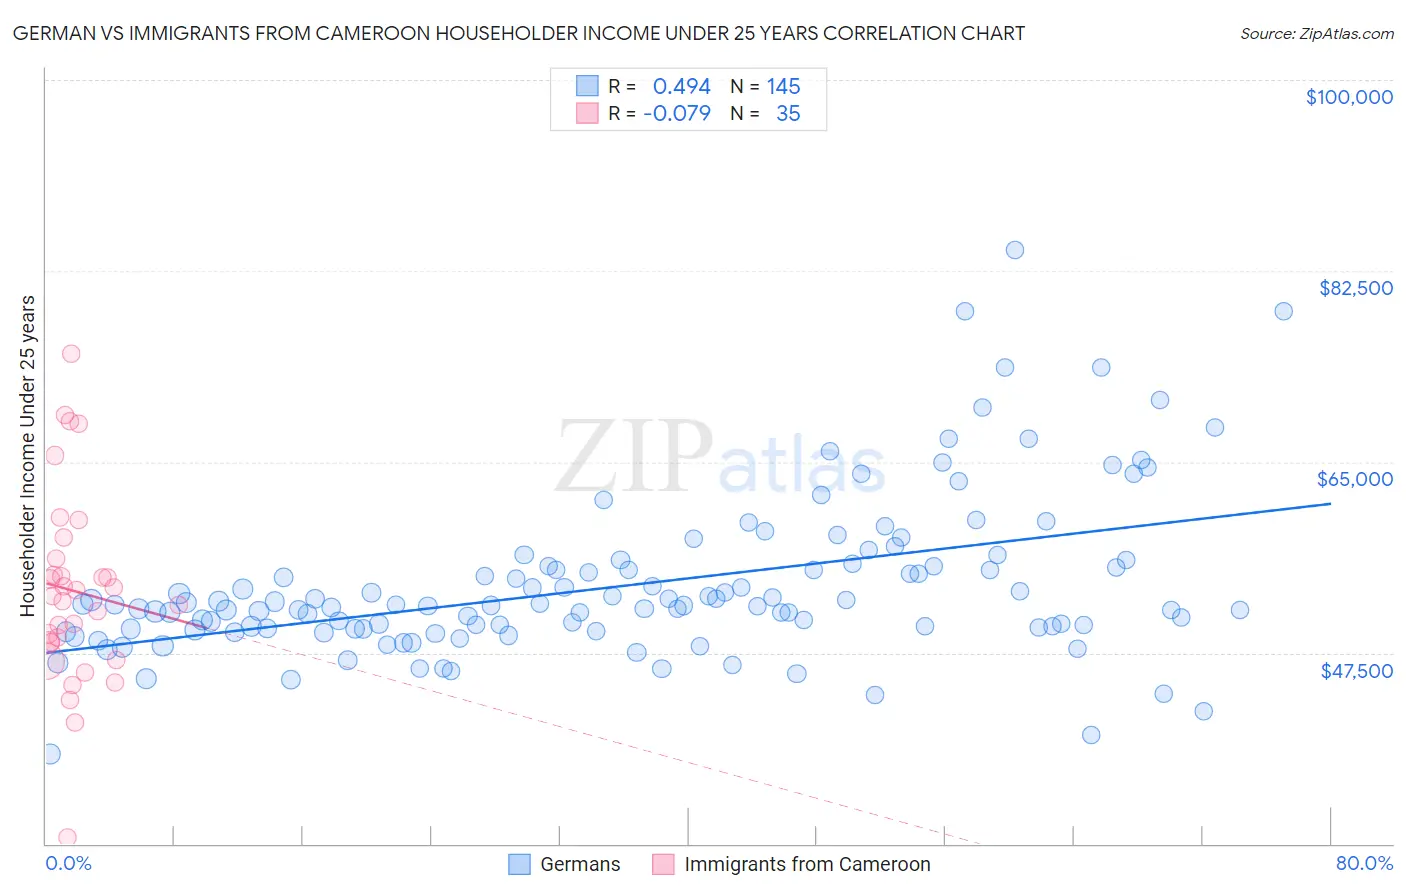
German vs Immigrants from Cameroon Householder Income Under 25 years Correlation Chart
The statistical analysis conducted on geographies consisting of 441,162,007 people shows a moderate positive correlation between the proportion of Germans and household income with householder under the age of 25 in the United States with a correlation coefficient (R) of 0.494 and weighted average of $50,804. Similarly, the statistical analysis conducted on geographies consisting of 122,005,064 people shows a slight negative correlation between the proportion of Immigrants from Cameroon and household income with householder under the age of 25 in the United States with a correlation coefficient (R) of -0.079 and weighted average of $51,433, a difference of 1.2%.
Householder Income Under 25 years Correlation Summary
| Measurement | German | Immigrants from Cameroon |
| Minimum | $38,255 | $30,616 |
| Maximum | $84,455 | $74,921 |
| Range | $46,200 | $44,305 |
| Mean | $53,710 | $53,155 |
| Median | $51,836 | $52,684 |
| Interquartile 25% (IQ1) | $49,689 | $48,466 |
| Interquartile 75% (IQ3) | $55,470 | $56,097 |
| Interquartile Range (IQR) | $5,781 | $7,631 |
| Standard Deviation (Sample) | $7,328 | $8,793 |
| Standard Deviation (Population) | $7,303 | $8,666 |
Similar Demographics by Householder Income Under 25 years
Demographics Similar to Germans by Householder Income Under 25 years
In terms of householder income under 25 years, the demographic groups most similar to Germans are English ($50,805, a difference of 0.0%), Iraqi ($50,802, a difference of 0.0%), Kenyan ($50,815, a difference of 0.020%), Spanish ($50,813, a difference of 0.020%), and Pennsylvania German ($50,852, a difference of 0.090%).
| Demographics | Rating | Rank | Householder Income Under 25 years |
| Jamaicans | 4.4 /100 | #230 | Tragic $50,929 |
| Ugandans | 4.3 /100 | #231 | Tragic $50,923 |
| Slovenes | 4.0 /100 | #232 | Tragic $50,886 |
| Pennsylvania Germans | 3.7 /100 | #233 | Tragic $50,852 |
| Kenyans | 3.3 /100 | #234 | Tragic $50,815 |
| Spanish | 3.3 /100 | #235 | Tragic $50,813 |
| English | 3.3 /100 | #236 | Tragic $50,805 |
| Germans | 3.3 /100 | #237 | Tragic $50,804 |
| Iraqis | 3.2 /100 | #238 | Tragic $50,802 |
| Immigrants | Caribbean | 2.9 /100 | #239 | Tragic $50,757 |
| Immigrants | Lebanon | 2.7 /100 | #240 | Tragic $50,729 |
| Immigrants | Micronesia | 2.5 /100 | #241 | Tragic $50,691 |
| Cubans | 2.3 /100 | #242 | Tragic $50,655 |
| Immigrants | Thailand | 2.2 /100 | #243 | Tragic $50,645 |
| Marshallese | 2.1 /100 | #244 | Tragic $50,627 |
Demographics Similar to Immigrants from Cameroon by Householder Income Under 25 years
In terms of householder income under 25 years, the demographic groups most similar to Immigrants from Cameroon are Czech ($51,421, a difference of 0.020%), Immigrants from Guatemala ($51,447, a difference of 0.030%), Immigrants from West Indies ($51,479, a difference of 0.090%), British ($51,477, a difference of 0.090%), and Cape Verdean ($51,387, a difference of 0.090%).
| Demographics | Rating | Rank | Householder Income Under 25 years |
| Palestinians | 16.1 /100 | #196 | Poor $51,515 |
| Pima | 15.7 /100 | #197 | Poor $51,503 |
| Immigrants | Syria | 15.4 /100 | #198 | Poor $51,494 |
| Swiss | 15.4 /100 | #199 | Poor $51,493 |
| Immigrants | West Indies | 14.9 /100 | #200 | Poor $51,479 |
| British | 14.9 /100 | #201 | Poor $51,477 |
| Immigrants | Guatemala | 14.0 /100 | #202 | Poor $51,447 |
| Immigrants | Cameroon | 13.6 /100 | #203 | Poor $51,433 |
| Czechs | 13.2 /100 | #204 | Poor $51,421 |
| Cape Verdeans | 12.3 /100 | #205 | Poor $51,387 |
| Immigrants | Latin America | 12.3 /100 | #206 | Poor $51,387 |
| South Africans | 12.2 /100 | #207 | Poor $51,383 |
| Immigrants | Jordan | 11.9 /100 | #208 | Poor $51,370 |
| Syrians | 11.4 /100 | #209 | Poor $51,353 |
| Immigrants | Ghana | 10.9 /100 | #210 | Poor $51,333 |