German Russian vs Immigrants from St. Vincent and the Grenadines Divorced or Separated
COMPARE
German Russian
Immigrants from St. Vincent and the Grenadines
Divorced or Separated
Divorced or Separated Comparison
German Russians
Immigrants from St. Vincent and the Grenadines
12.0%
DIVORCED OR SEPARATED
61.8/ 100
METRIC RATING
165th/ 347
METRIC RANK
11.8%
DIVORCED OR SEPARATED
88.4/ 100
METRIC RATING
129th/ 347
METRIC RANK
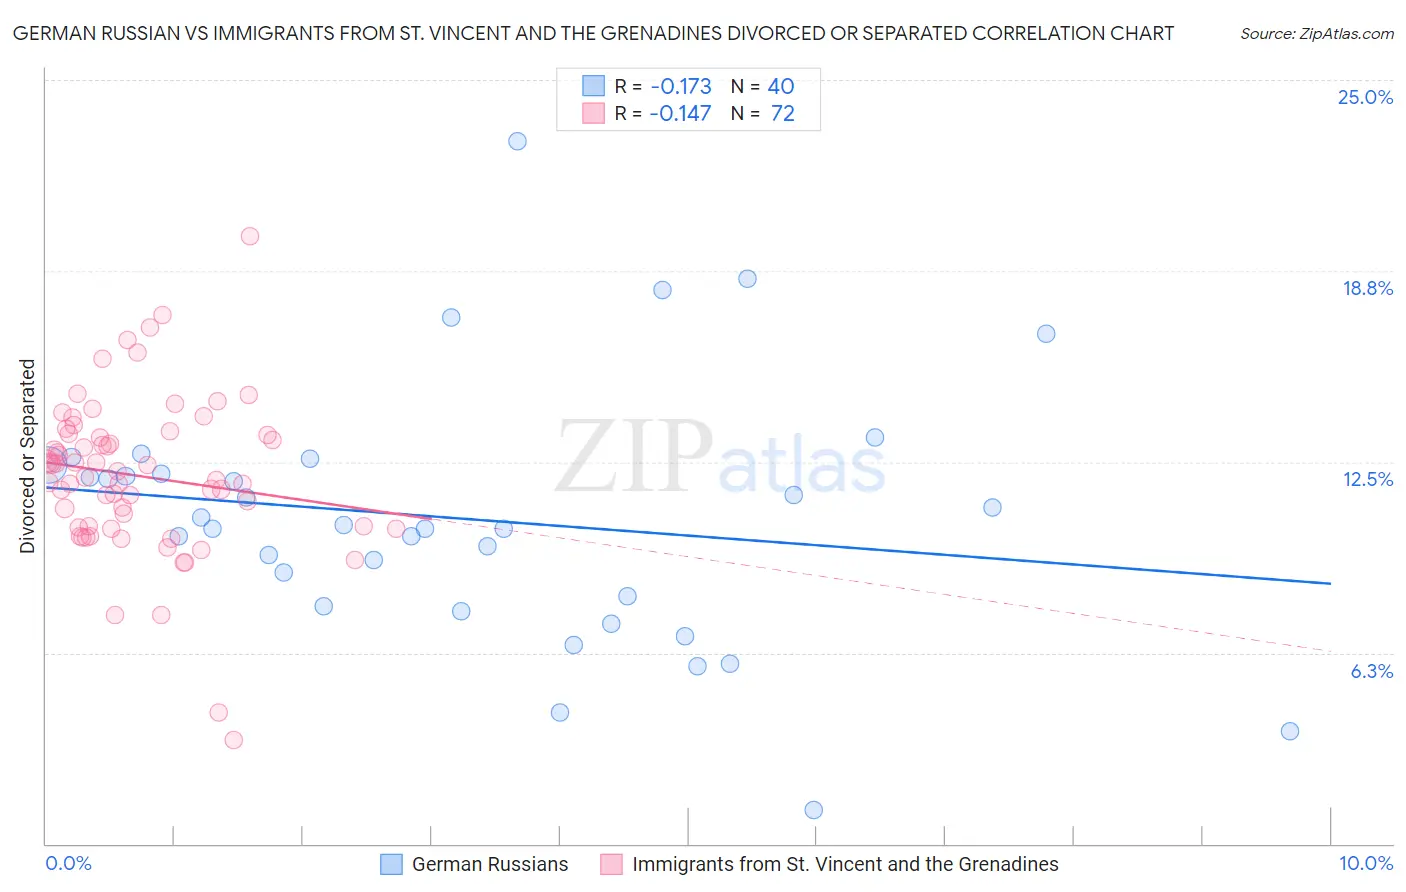
German Russian vs Immigrants from St. Vincent and the Grenadines Divorced or Separated Correlation Chart
The statistical analysis conducted on geographies consisting of 96,447,174 people shows a poor negative correlation between the proportion of German Russians and percentage of population currently divorced or separated in the United States with a correlation coefficient (R) of -0.173 and weighted average of 12.0%. Similarly, the statistical analysis conducted on geographies consisting of 56,190,890 people shows a poor negative correlation between the proportion of Immigrants from St. Vincent and the Grenadines and percentage of population currently divorced or separated in the United States with a correlation coefficient (R) of -0.147 and weighted average of 11.8%, a difference of 1.4%.
Divorced or Separated Correlation Summary
| Measurement | German Russian | Immigrants from St. Vincent and the Grenadines |
| Minimum | 1.1% | 3.4% |
| Maximum | 23.0% | 19.9% |
| Range | 21.9% | 16.5% |
| Mean | 10.6% | 12.0% |
| Median | 10.4% | 12.1% |
| Interquartile 25% (IQ1) | 7.9% | 10.4% |
| Interquartile 75% (IQ3) | 12.3% | 13.4% |
| Interquartile Range (IQR) | 4.3% | 3.0% |
| Standard Deviation (Sample) | 4.2% | 2.6% |
| Standard Deviation (Population) | 4.1% | 2.6% |
Similar Demographics by Divorced or Separated
Demographics Similar to German Russians by Divorced or Separated
In terms of divorced or separated, the demographic groups most similar to German Russians are Tohono O'odham (12.0%, a difference of 0.050%), Swiss (12.0%, a difference of 0.070%), Navajo (12.0%, a difference of 0.080%), Samoan (12.0%, a difference of 0.090%), and Marshallese (12.0%, a difference of 0.11%).
| Demographics | Rating | Rank | Divorced or Separated |
| Icelanders | 66.0 /100 | #158 | Good 12.0% |
| Immigrants | Barbados | 66.0 /100 | #159 | Good 12.0% |
| Immigrants | Scotland | 65.8 /100 | #160 | Good 12.0% |
| Marshallese | 64.6 /100 | #161 | Good 12.0% |
| Samoans | 64.3 /100 | #162 | Good 12.0% |
| Navajo | 63.9 /100 | #163 | Good 12.0% |
| Swiss | 63.6 /100 | #164 | Good 12.0% |
| German Russians | 61.8 /100 | #165 | Good 12.0% |
| Tohono O'odham | 60.4 /100 | #166 | Good 12.0% |
| Ethiopians | 58.5 /100 | #167 | Average 12.0% |
| Serbians | 57.1 /100 | #168 | Average 12.0% |
| Immigrants | Peru | 57.0 /100 | #169 | Average 12.0% |
| Mexican American Indians | 55.8 /100 | #170 | Average 12.0% |
| Costa Ricans | 53.3 /100 | #171 | Average 12.0% |
| Immigrants | Mexico | 53.2 /100 | #172 | Average 12.0% |
Demographics Similar to Immigrants from St. Vincent and the Grenadines by Divorced or Separated
In terms of divorced or separated, the demographic groups most similar to Immigrants from St. Vincent and the Grenadines are Immigrants from Austria (11.8%, a difference of 0.010%), Immigrants from Cambodia (11.8%, a difference of 0.020%), South African (11.8%, a difference of 0.040%), Immigrants from Ecuador (11.8%, a difference of 0.040%), and Immigrants from Afghanistan (11.8%, a difference of 0.040%).
| Demographics | Rating | Rank | Divorced or Separated |
| Menominee | 93.8 /100 | #122 | Exceptional 11.8% |
| Immigrants | Immigrants | 93.7 /100 | #123 | Exceptional 11.8% |
| Ugandans | 93.1 /100 | #124 | Exceptional 11.8% |
| Ukrainians | 92.3 /100 | #125 | Exceptional 11.8% |
| South American Indians | 92.1 /100 | #126 | Exceptional 11.8% |
| South Africans | 88.9 /100 | #127 | Excellent 11.8% |
| Immigrants | Ecuador | 88.9 /100 | #128 | Excellent 11.8% |
| Immigrants | St. Vincent and the Grenadines | 88.4 /100 | #129 | Excellent 11.8% |
| Immigrants | Austria | 88.2 /100 | #130 | Excellent 11.8% |
| Immigrants | Cambodia | 88.2 /100 | #131 | Excellent 11.8% |
| Immigrants | Afghanistan | 87.9 /100 | #132 | Excellent 11.8% |
| New Zealanders | 87.5 /100 | #133 | Excellent 11.9% |
| Argentineans | 85.1 /100 | #134 | Excellent 11.9% |
| Danes | 84.8 /100 | #135 | Excellent 11.9% |
| Carpatho Rusyns | 84.8 /100 | #136 | Excellent 11.9% |