French Canadian vs Immigrants from Italy In Labor Force | Age 25-29
COMPARE
French Canadian
Immigrants from Italy
In Labor Force | Age 25-29
In Labor Force | Age 25-29 Comparison
French Canadians
Immigrants from Italy
85.2%
IN LABOR FORCE | AGE 25-29
96.5/ 100
METRIC RATING
87th/ 347
METRIC RANK
85.4%
IN LABOR FORCE | AGE 25-29
99.3/ 100
METRIC RATING
64th/ 347
METRIC RANK
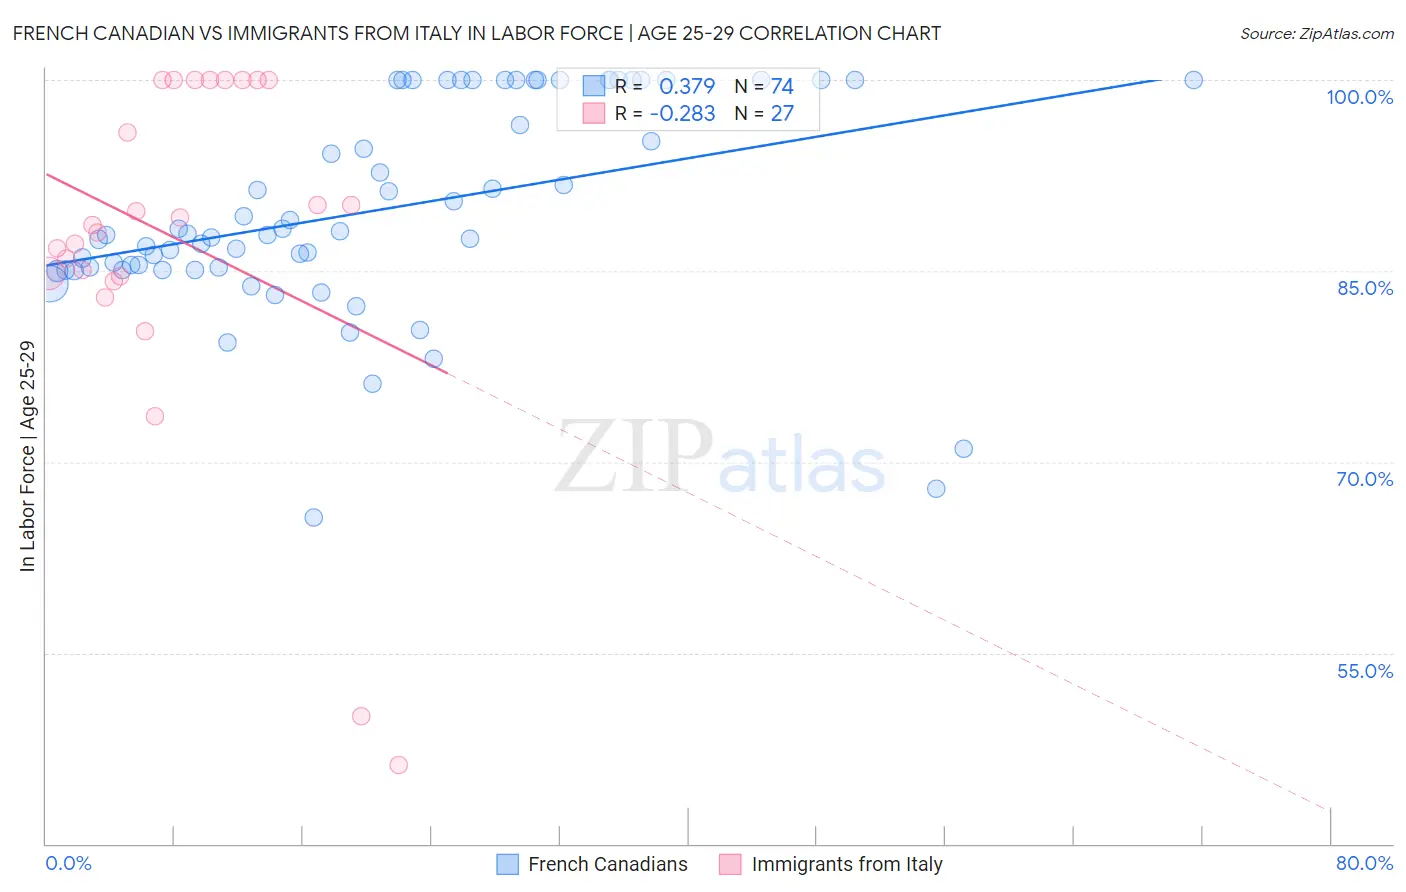
French Canadian vs Immigrants from Italy In Labor Force | Age 25-29 Correlation Chart
The statistical analysis conducted on geographies consisting of 502,121,240 people shows a mild positive correlation between the proportion of French Canadians and labor force participation rate among population between the ages 25 and 29 in the United States with a correlation coefficient (R) of 0.379 and weighted average of 85.2%. Similarly, the statistical analysis conducted on geographies consisting of 324,138,046 people shows a weak negative correlation between the proportion of Immigrants from Italy and labor force participation rate among population between the ages 25 and 29 in the United States with a correlation coefficient (R) of -0.283 and weighted average of 85.4%, a difference of 0.30%.
In Labor Force | Age 25-29 Correlation Summary
| Measurement | French Canadian | Immigrants from Italy |
| Minimum | 65.6% | 46.2% |
| Maximum | 100.0% | 100.0% |
| Range | 34.4% | 53.8% |
| Mean | 89.8% | 87.5% |
| Median | 87.8% | 88.6% |
| Interquartile 25% (IQ1) | 85.1% | 84.6% |
| Interquartile 75% (IQ3) | 100.0% | 100.0% |
| Interquartile Range (IQR) | 14.9% | 15.4% |
| Standard Deviation (Sample) | 8.2% | 13.5% |
| Standard Deviation (Population) | 8.2% | 13.3% |
Similar Demographics by In Labor Force | Age 25-29
Demographics Similar to French Canadians by In Labor Force | Age 25-29
In terms of in labor force | age 25-29, the demographic groups most similar to French Canadians are Immigrants from Croatia (85.2%, a difference of 0.0%), Immigrants from Eastern Europe (85.2%, a difference of 0.010%), Immigrants from Africa (85.2%, a difference of 0.010%), Ukrainian (85.2%, a difference of 0.010%), and Immigrants from France (85.2%, a difference of 0.010%).
| Demographics | Rating | Rank | In Labor Force | Age 25-29 |
| Immigrants | Zimbabwe | 97.6 /100 | #80 | Exceptional 85.2% |
| Immigrants | Northern Europe | 97.2 /100 | #81 | Exceptional 85.2% |
| Okinawans | 97.0 /100 | #82 | Exceptional 85.2% |
| Immigrants | Europe | 96.8 /100 | #83 | Exceptional 85.2% |
| Immigrants | Eastern Europe | 96.8 /100 | #84 | Exceptional 85.2% |
| Immigrants | Africa | 96.7 /100 | #85 | Exceptional 85.2% |
| Ukrainians | 96.7 /100 | #86 | Exceptional 85.2% |
| French Canadians | 96.5 /100 | #87 | Exceptional 85.2% |
| Immigrants | Croatia | 96.4 /100 | #88 | Exceptional 85.2% |
| Immigrants | France | 96.3 /100 | #89 | Exceptional 85.2% |
| Burmese | 95.9 /100 | #90 | Exceptional 85.1% |
| Immigrants | Moldova | 95.8 /100 | #91 | Exceptional 85.1% |
| Immigrants | Costa Rica | 95.5 /100 | #92 | Exceptional 85.1% |
| Austrians | 95.3 /100 | #93 | Exceptional 85.1% |
| Immigrants | Korea | 94.8 /100 | #94 | Exceptional 85.1% |
Demographics Similar to Immigrants from Italy by In Labor Force | Age 25-29
In terms of in labor force | age 25-29, the demographic groups most similar to Immigrants from Italy are Immigrants from Czechoslovakia (85.4%, a difference of 0.010%), Immigrants from Scotland (85.4%, a difference of 0.010%), Immigrants from Kenya (85.4%, a difference of 0.020%), Immigrants from Turkey (85.4%, a difference of 0.020%), and Taiwanese (85.4%, a difference of 0.030%).
| Demographics | Rating | Rank | In Labor Force | Age 25-29 |
| Estonians | 99.6 /100 | #57 | Exceptional 85.5% |
| Greeks | 99.6 /100 | #58 | Exceptional 85.5% |
| Immigrants | Morocco | 99.5 /100 | #59 | Exceptional 85.5% |
| Thais | 99.5 /100 | #60 | Exceptional 85.5% |
| Serbians | 99.5 /100 | #61 | Exceptional 85.5% |
| Taiwanese | 99.4 /100 | #62 | Exceptional 85.4% |
| Immigrants | Kenya | 99.4 /100 | #63 | Exceptional 85.4% |
| Immigrants | Italy | 99.3 /100 | #64 | Exceptional 85.4% |
| Immigrants | Czechoslovakia | 99.3 /100 | #65 | Exceptional 85.4% |
| Immigrants | Scotland | 99.3 /100 | #66 | Exceptional 85.4% |
| Immigrants | Turkey | 99.2 /100 | #67 | Exceptional 85.4% |
| Immigrants | Cameroon | 99.2 /100 | #68 | Exceptional 85.4% |
| Menominee | 99.1 /100 | #69 | Exceptional 85.4% |
| Immigrants | Sweden | 99.1 /100 | #70 | Exceptional 85.4% |
| Kenyans | 99.0 /100 | #71 | Exceptional 85.4% |