French Canadian vs Immigrants from Central America Unemployment Among Ages 45 to 54 years
COMPARE
French Canadian
Immigrants from Central America
Unemployment Among Ages 45 to 54 years
Unemployment Among Ages 45 to 54 years Comparison
French Canadians
Immigrants from Central America
4.4%
UNEMPLOYMENT AMONG AGES 45 TO 54 YEARS
91.0/ 100
METRIC RATING
113th/ 347
METRIC RANK
5.0%
UNEMPLOYMENT AMONG AGES 45 TO 54 YEARS
0.0/ 100
METRIC RATING
272nd/ 347
METRIC RANK
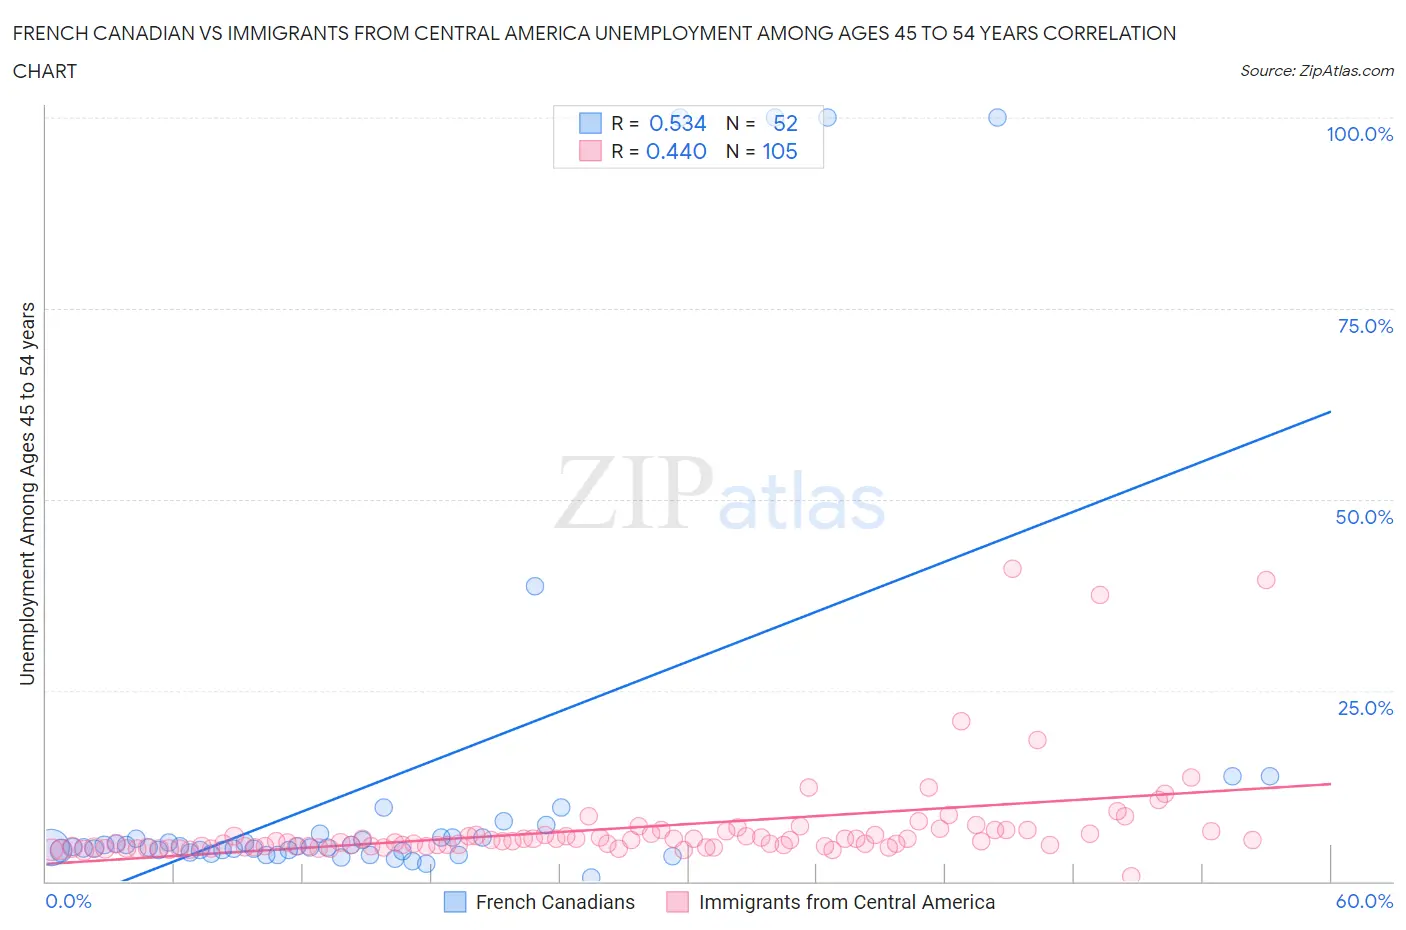
French Canadian vs Immigrants from Central America Unemployment Among Ages 45 to 54 years Correlation Chart
The statistical analysis conducted on geographies consisting of 476,387,703 people shows a substantial positive correlation between the proportion of French Canadians and unemployment rate among population between the ages 45 and 54 in the United States with a correlation coefficient (R) of 0.534 and weighted average of 4.4%. Similarly, the statistical analysis conducted on geographies consisting of 505,939,152 people shows a moderate positive correlation between the proportion of Immigrants from Central America and unemployment rate among population between the ages 45 and 54 in the United States with a correlation coefficient (R) of 0.440 and weighted average of 5.0%, a difference of 13.1%.
Unemployment Among Ages 45 to 54 years Correlation Summary
| Measurement | French Canadian | Immigrants from Central America |
| Minimum | 0.50% | 0.70% |
| Maximum | 100.0% | 41.0% |
| Range | 99.5% | 40.3% |
| Mean | 12.9% | 6.9% |
| Median | 4.5% | 5.2% |
| Interquartile 25% (IQ1) | 4.0% | 4.5% |
| Interquartile 75% (IQ3) | 5.7% | 6.4% |
| Interquartile Range (IQR) | 1.8% | 1.9% |
| Standard Deviation (Sample) | 25.9% | 6.2% |
| Standard Deviation (Population) | 25.7% | 6.2% |
Similar Demographics by Unemployment Among Ages 45 to 54 years
Demographics Similar to French Canadians by Unemployment Among Ages 45 to 54 years
In terms of unemployment among ages 45 to 54 years, the demographic groups most similar to French Canadians are Immigrants from Saudi Arabia (4.4%, a difference of 0.010%), Immigrants from Chile (4.4%, a difference of 0.020%), Immigrants from Nicaragua (4.4%, a difference of 0.040%), Pakistani (4.4%, a difference of 0.040%), and Immigrants from England (4.4%, a difference of 0.050%).
| Demographics | Rating | Rank | Unemployment Among Ages 45 to 54 years |
| Iranians | 92.5 /100 | #106 | Exceptional 4.4% |
| Immigrants | South Africa | 92.5 /100 | #107 | Exceptional 4.4% |
| Russians | 92.1 /100 | #108 | Exceptional 4.4% |
| New Zealanders | 91.9 /100 | #109 | Exceptional 4.4% |
| Immigrants | England | 91.3 /100 | #110 | Exceptional 4.4% |
| Immigrants | Nicaragua | 91.3 /100 | #111 | Exceptional 4.4% |
| Immigrants | Saudi Arabia | 91.1 /100 | #112 | Exceptional 4.4% |
| French Canadians | 91.0 /100 | #113 | Exceptional 4.4% |
| Immigrants | Chile | 90.9 /100 | #114 | Exceptional 4.4% |
| Pakistanis | 90.7 /100 | #115 | Exceptional 4.4% |
| Immigrants | North Macedonia | 90.6 /100 | #116 | Exceptional 4.4% |
| South Africans | 90.4 /100 | #117 | Exceptional 4.4% |
| Immigrants | Romania | 90.0 /100 | #118 | Exceptional 4.4% |
| Native Hawaiians | 90.0 /100 | #119 | Excellent 4.4% |
| Americans | 89.6 /100 | #120 | Excellent 4.4% |
Demographics Similar to Immigrants from Central America by Unemployment Among Ages 45 to 54 years
In terms of unemployment among ages 45 to 54 years, the demographic groups most similar to Immigrants from Central America are Immigrants from Latin America (5.0%, a difference of 0.16%), Cajun (5.0%, a difference of 0.17%), U.S. Virgin Islander (5.0%, a difference of 0.22%), Immigrants from Ghana (5.0%, a difference of 0.25%), and Bermudan (5.0%, a difference of 0.27%).
| Demographics | Rating | Rank | Unemployment Among Ages 45 to 54 years |
| Immigrants | Somalia | 0.1 /100 | #265 | Tragic 4.9% |
| Ghanaians | 0.0 /100 | #266 | Tragic 4.9% |
| Bahamians | 0.0 /100 | #267 | Tragic 4.9% |
| Immigrants | Uzbekistan | 0.0 /100 | #268 | Tragic 4.9% |
| Somalis | 0.0 /100 | #269 | Tragic 5.0% |
| Immigrants | Ghana | 0.0 /100 | #270 | Tragic 5.0% |
| Cajuns | 0.0 /100 | #271 | Tragic 5.0% |
| Immigrants | Central America | 0.0 /100 | #272 | Tragic 5.0% |
| Immigrants | Latin America | 0.0 /100 | #273 | Tragic 5.0% |
| U.S. Virgin Islanders | 0.0 /100 | #274 | Tragic 5.0% |
| Bermudans | 0.0 /100 | #275 | Tragic 5.0% |
| French American Indians | 0.0 /100 | #276 | Tragic 5.0% |
| Immigrants | Mexico | 0.0 /100 | #277 | Tragic 5.0% |
| Dutch West Indians | 0.0 /100 | #278 | Tragic 5.0% |
| Nepalese | 0.0 /100 | #279 | Tragic 5.0% |