Immigrants from Poland vs Immigrants from Central America Births to Unmarried Women
COMPARE
Immigrants from Poland
Immigrants from Central America
Births to Unmarried Women
Births to Unmarried Women Comparison
Immigrants from Poland
Immigrants from Central America
28.9%
BIRTHS TO UNMARRIED WOMEN
97.6/ 100
METRIC RATING
84th/ 347
METRIC RANK
37.4%
BIRTHS TO UNMARRIED WOMEN
0.0/ 100
METRIC RATING
284th/ 347
METRIC RANK
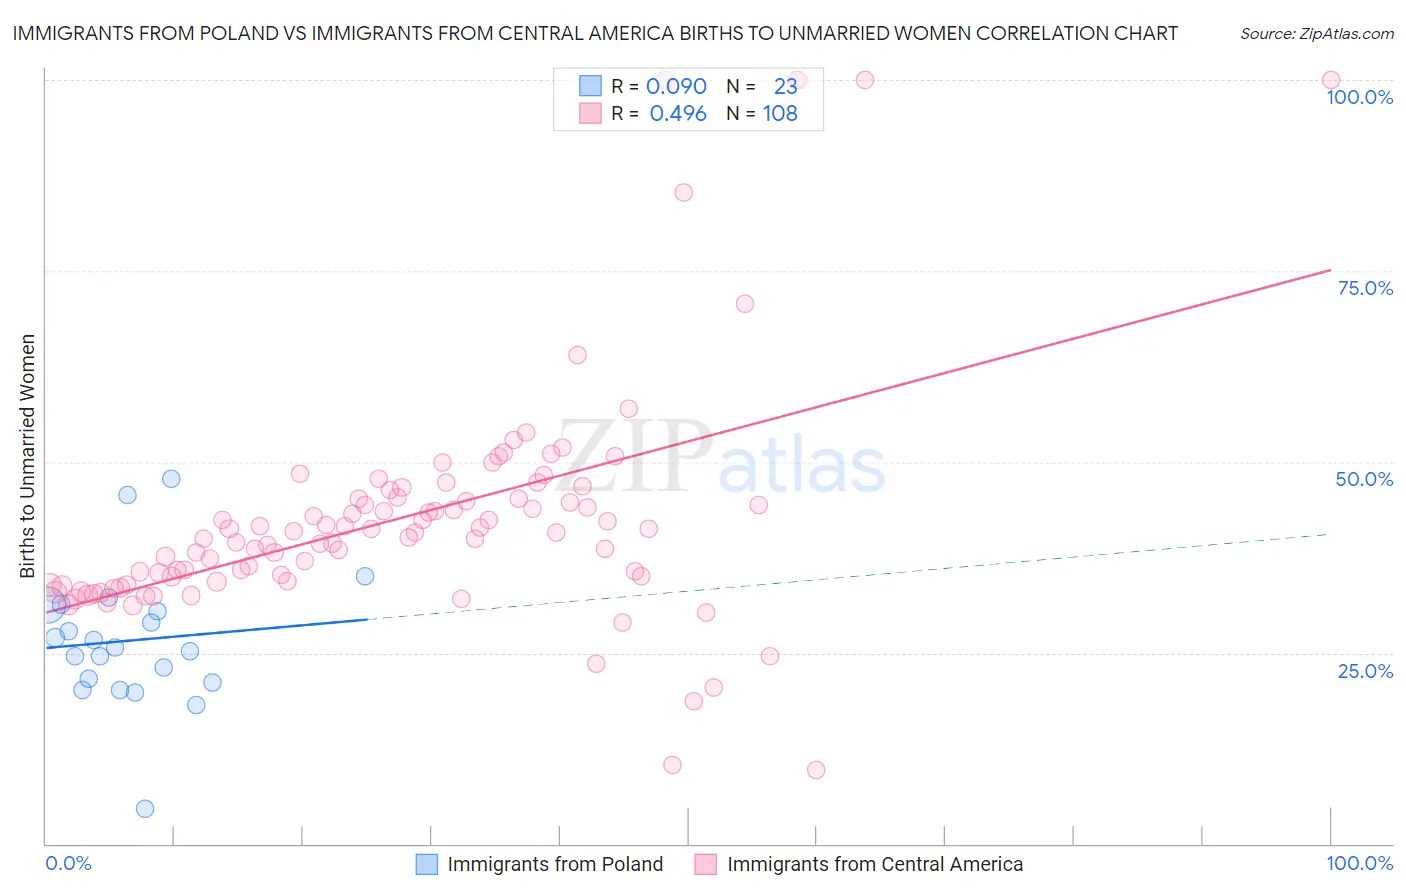
Immigrants from Poland vs Immigrants from Central America Births to Unmarried Women Correlation Chart
The statistical analysis conducted on geographies consisting of 283,221,739 people shows a slight positive correlation between the proportion of Immigrants from Poland and percentage of births to unmarried women in the United States with a correlation coefficient (R) of 0.090 and weighted average of 28.9%. Similarly, the statistical analysis conducted on geographies consisting of 486,080,403 people shows a moderate positive correlation between the proportion of Immigrants from Central America and percentage of births to unmarried women in the United States with a correlation coefficient (R) of 0.496 and weighted average of 37.4%, a difference of 29.6%.
Births to Unmarried Women Correlation Summary
| Measurement | Immigrants from Poland | Immigrants from Central America |
| Minimum | 4.7% | 9.7% |
| Maximum | 47.8% | 100.0% |
| Range | 43.2% | 90.3% |
| Mean | 26.6% | 42.8% |
| Median | 25.7% | 40.7% |
| Interquartile 25% (IQ1) | 21.1% | 34.4% |
| Interquartile 75% (IQ3) | 31.2% | 45.2% |
| Interquartile Range (IQR) | 10.1% | 10.9% |
| Standard Deviation (Sample) | 8.9% | 16.0% |
| Standard Deviation (Population) | 8.7% | 16.0% |
Similar Demographics by Births to Unmarried Women
Demographics Similar to Immigrants from Poland by Births to Unmarried Women
In terms of births to unmarried women, the demographic groups most similar to Immigrants from Poland are Sri Lankan (28.9%, a difference of 0.17%), Immigrants from Jordan (29.0%, a difference of 0.24%), Taiwanese (29.0%, a difference of 0.32%), Immigrants from France (29.0%, a difference of 0.32%), and Immigrants from Kuwait (28.8%, a difference of 0.42%).
| Demographics | Rating | Rank | Births to Unmarried Women |
| Immigrants | Northern Europe | 98.3 /100 | #77 | Exceptional 28.6% |
| Zimbabweans | 98.2 /100 | #78 | Exceptional 28.7% |
| Danes | 98.2 /100 | #79 | Exceptional 28.7% |
| Immigrants | Afghanistan | 98.1 /100 | #80 | Exceptional 28.7% |
| Immigrants | Austria | 98.1 /100 | #81 | Exceptional 28.7% |
| Romanians | 98.0 /100 | #82 | Exceptional 28.7% |
| Immigrants | Kuwait | 98.0 /100 | #83 | Exceptional 28.8% |
| Immigrants | Poland | 97.6 /100 | #84 | Exceptional 28.9% |
| Sri Lankans | 97.5 /100 | #85 | Exceptional 28.9% |
| Immigrants | Jordan | 97.4 /100 | #86 | Exceptional 29.0% |
| Taiwanese | 97.3 /100 | #87 | Exceptional 29.0% |
| Immigrants | France | 97.3 /100 | #88 | Exceptional 29.0% |
| Immigrants | Saudi Arabia | 97.0 /100 | #89 | Exceptional 29.1% |
| Immigrants | Latvia | 96.8 /100 | #90 | Exceptional 29.1% |
| Immigrants | Fiji | 96.6 /100 | #91 | Exceptional 29.2% |
Demographics Similar to Immigrants from Central America by Births to Unmarried Women
In terms of births to unmarried women, the demographic groups most similar to Immigrants from Central America are Spanish American Indian (37.4%, a difference of 0.060%), Immigrants from Mexico (37.5%, a difference of 0.10%), Immigrants from Guatemala (37.5%, a difference of 0.11%), Liberian (37.4%, a difference of 0.14%), and Immigrants from Belize (37.3%, a difference of 0.31%).
| Demographics | Rating | Rank | Births to Unmarried Women |
| Guatemalans | 0.1 /100 | #277 | Tragic 37.1% |
| Immigrants | Latin America | 0.1 /100 | #278 | Tragic 37.1% |
| West Indians | 0.1 /100 | #279 | Tragic 37.3% |
| Immigrants | St. Vincent and the Grenadines | 0.1 /100 | #280 | Tragic 37.3% |
| Immigrants | Belize | 0.1 /100 | #281 | Tragic 37.3% |
| Liberians | 0.0 /100 | #282 | Tragic 37.4% |
| Spanish American Indians | 0.0 /100 | #283 | Tragic 37.4% |
| Immigrants | Central America | 0.0 /100 | #284 | Tragic 37.4% |
| Immigrants | Mexico | 0.0 /100 | #285 | Tragic 37.5% |
| Immigrants | Guatemala | 0.0 /100 | #286 | Tragic 37.5% |
| Creek | 0.0 /100 | #287 | Tragic 37.6% |
| Immigrants | Liberia | 0.0 /100 | #288 | Tragic 37.6% |
| Alaskan Athabascans | 0.0 /100 | #289 | Tragic 37.7% |
| Hispanics or Latinos | 0.0 /100 | #290 | Tragic 37.8% |
| Seminole | 0.0 /100 | #291 | Tragic 37.9% |