American vs Immigrants from Central America Births to Unmarried Women
COMPARE
American
Immigrants from Central America
Births to Unmarried Women
Births to Unmarried Women Comparison
Americans
Immigrants from Central America
36.4%
BIRTHS TO UNMARRIED WOMEN
0.2/ 100
METRIC RATING
258th/ 347
METRIC RANK
37.4%
BIRTHS TO UNMARRIED WOMEN
0.0/ 100
METRIC RATING
284th/ 347
METRIC RANK
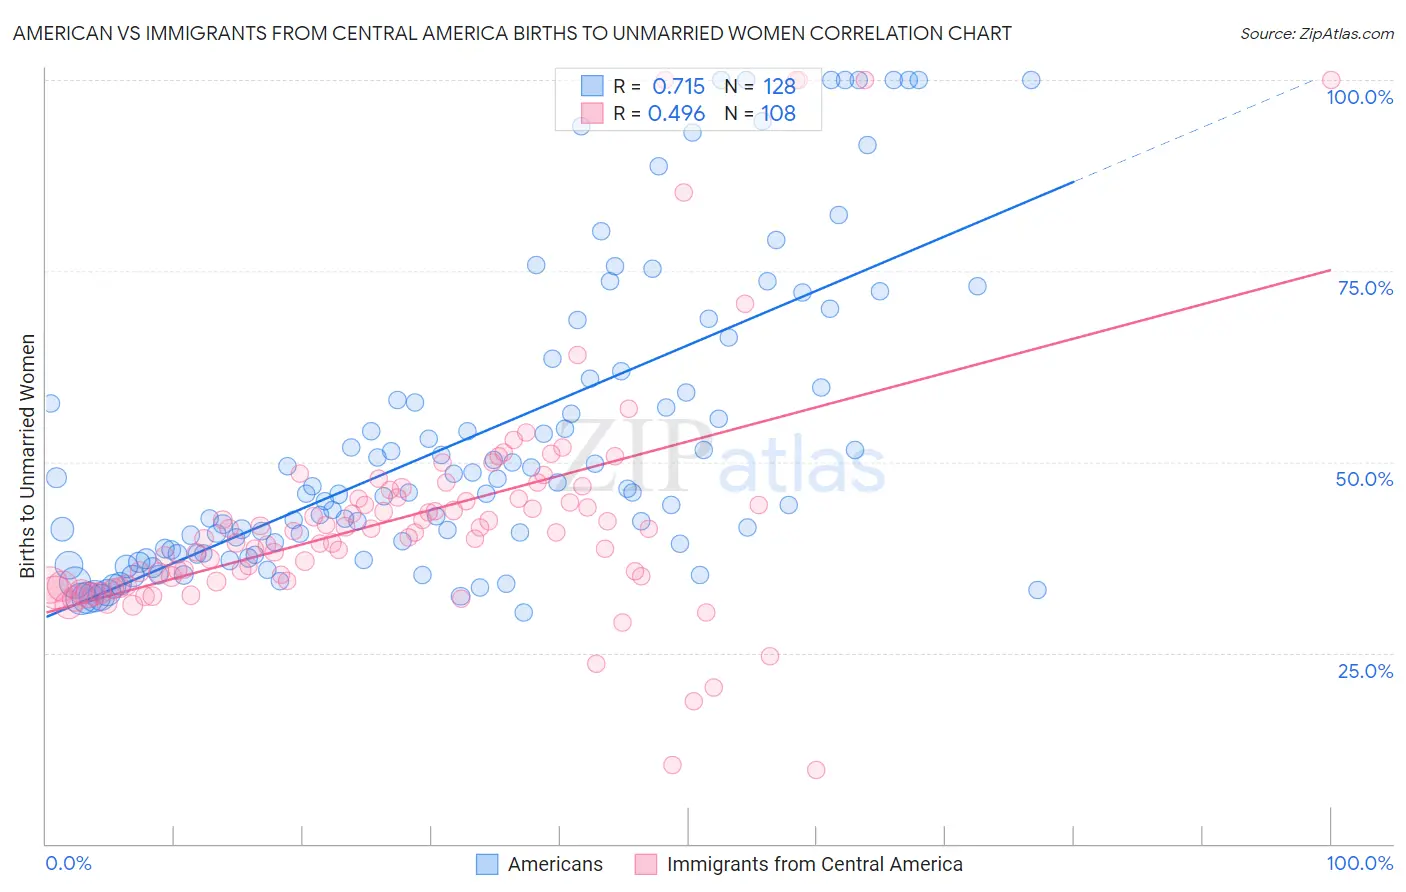
American vs Immigrants from Central America Births to Unmarried Women Correlation Chart
The statistical analysis conducted on geographies consisting of 512,571,138 people shows a strong positive correlation between the proportion of Americans and percentage of births to unmarried women in the United States with a correlation coefficient (R) of 0.715 and weighted average of 36.4%. Similarly, the statistical analysis conducted on geographies consisting of 486,080,403 people shows a moderate positive correlation between the proportion of Immigrants from Central America and percentage of births to unmarried women in the United States with a correlation coefficient (R) of 0.496 and weighted average of 37.4%, a difference of 2.8%.
Births to Unmarried Women Correlation Summary
| Measurement | American | Immigrants from Central America |
| Minimum | 30.2% | 9.7% |
| Maximum | 100.0% | 100.0% |
| Range | 69.8% | 90.3% |
| Mean | 53.1% | 42.8% |
| Median | 46.0% | 40.7% |
| Interquartile 25% (IQ1) | 38.3% | 34.4% |
| Interquartile 75% (IQ3) | 60.3% | 45.2% |
| Interquartile Range (IQR) | 22.0% | 10.9% |
| Standard Deviation (Sample) | 19.8% | 16.0% |
| Standard Deviation (Population) | 19.7% | 16.0% |
Similar Demographics by Births to Unmarried Women
Demographics Similar to Americans by Births to Unmarried Women
In terms of births to unmarried women, the demographic groups most similar to Americans are Immigrants from El Salvador (36.4%, a difference of 0.050%), Ottawa (36.5%, a difference of 0.16%), Trinidadian and Tobagonian (36.5%, a difference of 0.17%), Immigrants from Grenada (36.3%, a difference of 0.28%), and Chickasaw (36.3%, a difference of 0.31%).
| Demographics | Rating | Rank | Births to Unmarried Women |
| Immigrants | Western Africa | 0.3 /100 | #251 | Tragic 36.0% |
| Salvadorans | 0.3 /100 | #252 | Tragic 36.0% |
| Immigrants | Portugal | 0.2 /100 | #253 | Tragic 36.2% |
| Potawatomi | 0.2 /100 | #254 | Tragic 36.2% |
| Chickasaw | 0.2 /100 | #255 | Tragic 36.3% |
| Immigrants | Trinidad and Tobago | 0.2 /100 | #256 | Tragic 36.3% |
| Immigrants | Grenada | 0.2 /100 | #257 | Tragic 36.3% |
| Americans | 0.2 /100 | #258 | Tragic 36.4% |
| Immigrants | El Salvador | 0.2 /100 | #259 | Tragic 36.4% |
| Ottawa | 0.2 /100 | #260 | Tragic 36.5% |
| Trinidadians and Tobagonians | 0.2 /100 | #261 | Tragic 36.5% |
| French American Indians | 0.1 /100 | #262 | Tragic 36.6% |
| Nicaraguans | 0.1 /100 | #263 | Tragic 36.6% |
| Sub-Saharan Africans | 0.1 /100 | #264 | Tragic 36.7% |
| Cherokee | 0.1 /100 | #265 | Tragic 36.7% |
Demographics Similar to Immigrants from Central America by Births to Unmarried Women
In terms of births to unmarried women, the demographic groups most similar to Immigrants from Central America are Spanish American Indian (37.4%, a difference of 0.060%), Immigrants from Mexico (37.5%, a difference of 0.10%), Immigrants from Guatemala (37.5%, a difference of 0.11%), Liberian (37.4%, a difference of 0.14%), and Immigrants from Belize (37.3%, a difference of 0.31%).
| Demographics | Rating | Rank | Births to Unmarried Women |
| Guatemalans | 0.1 /100 | #277 | Tragic 37.1% |
| Immigrants | Latin America | 0.1 /100 | #278 | Tragic 37.1% |
| West Indians | 0.1 /100 | #279 | Tragic 37.3% |
| Immigrants | St. Vincent and the Grenadines | 0.1 /100 | #280 | Tragic 37.3% |
| Immigrants | Belize | 0.1 /100 | #281 | Tragic 37.3% |
| Liberians | 0.0 /100 | #282 | Tragic 37.4% |
| Spanish American Indians | 0.0 /100 | #283 | Tragic 37.4% |
| Immigrants | Central America | 0.0 /100 | #284 | Tragic 37.4% |
| Immigrants | Mexico | 0.0 /100 | #285 | Tragic 37.5% |
| Immigrants | Guatemala | 0.0 /100 | #286 | Tragic 37.5% |
| Creek | 0.0 /100 | #287 | Tragic 37.6% |
| Immigrants | Liberia | 0.0 /100 | #288 | Tragic 37.6% |
| Alaskan Athabascans | 0.0 /100 | #289 | Tragic 37.7% |
| Hispanics or Latinos | 0.0 /100 | #290 | Tragic 37.8% |
| Seminole | 0.0 /100 | #291 | Tragic 37.9% |