French American Indian vs Immigrants from Colombia Births to Unmarried Women
COMPARE
French American Indian
Immigrants from Colombia
Births to Unmarried Women
Births to Unmarried Women Comparison
French American Indians
Immigrants from Colombia
36.6%
BIRTHS TO UNMARRIED WOMEN
0.1/ 100
METRIC RATING
262nd/ 347
METRIC RANK
32.6%
BIRTHS TO UNMARRIED WOMEN
21.7/ 100
METRIC RATING
196th/ 347
METRIC RANK
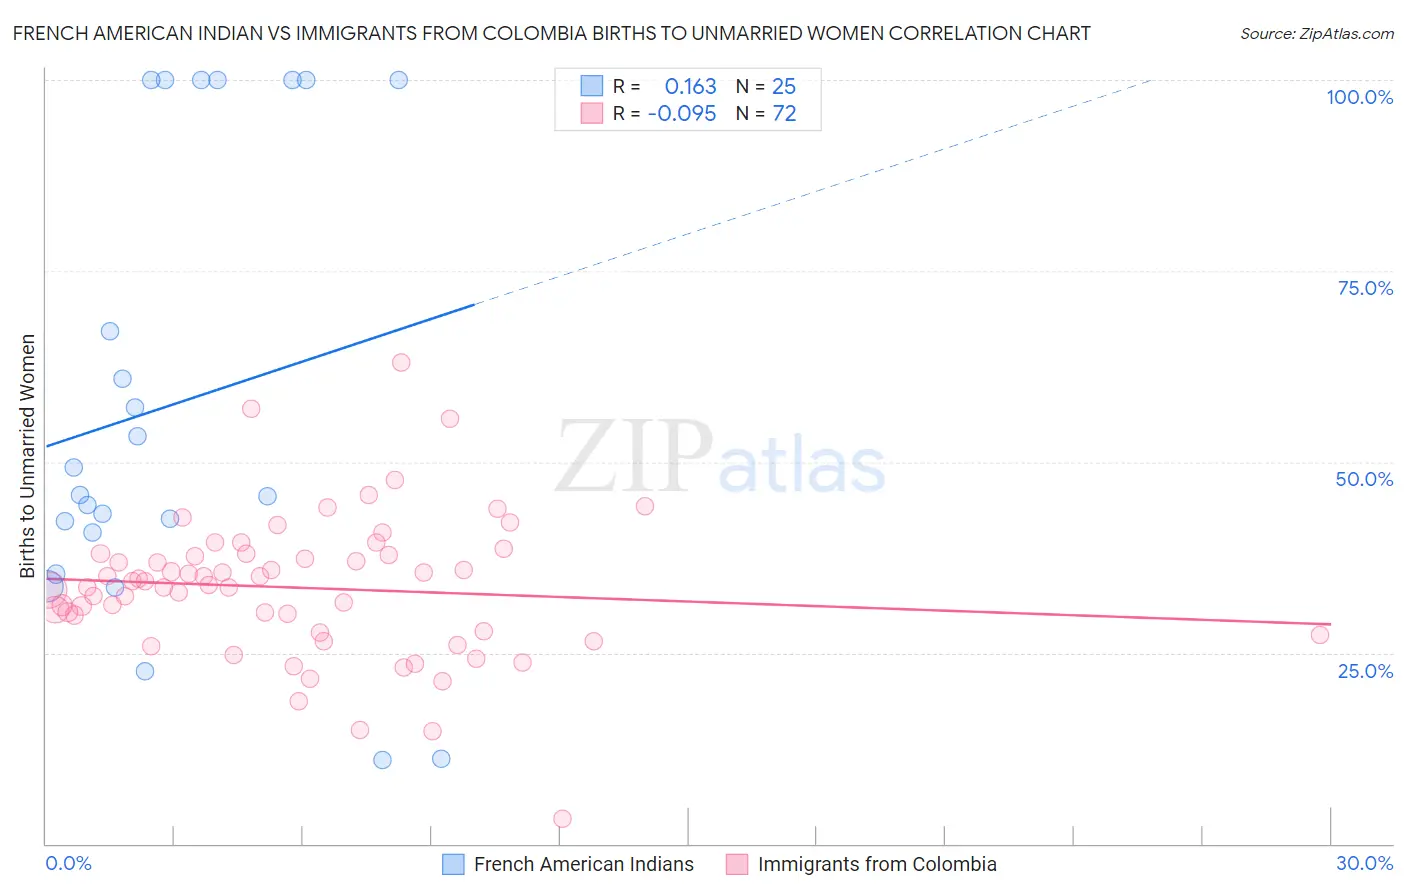
French American Indian vs Immigrants from Colombia Births to Unmarried Women Correlation Chart
The statistical analysis conducted on geographies consisting of 128,368,933 people shows a poor positive correlation between the proportion of French American Indians and percentage of births to unmarried women in the United States with a correlation coefficient (R) of 0.163 and weighted average of 36.6%. Similarly, the statistical analysis conducted on geographies consisting of 355,596,332 people shows a slight negative correlation between the proportion of Immigrants from Colombia and percentage of births to unmarried women in the United States with a correlation coefficient (R) of -0.095 and weighted average of 32.6%, a difference of 12.2%.
Births to Unmarried Women Correlation Summary
| Measurement | French American Indian | Immigrants from Colombia |
| Minimum | 10.9% | 3.3% |
| Maximum | 100.0% | 63.1% |
| Range | 89.1% | 59.8% |
| Mean | 57.6% | 33.5% |
| Median | 45.7% | 34.1% |
| Interquartile 25% (IQ1) | 38.0% | 27.8% |
| Interquartile 75% (IQ3) | 100.0% | 37.9% |
| Interquartile Range (IQR) | 62.0% | 10.1% |
| Standard Deviation (Sample) | 29.9% | 9.4% |
| Standard Deviation (Population) | 29.3% | 9.3% |
Similar Demographics by Births to Unmarried Women
Demographics Similar to French American Indians by Births to Unmarried Women
In terms of births to unmarried women, the demographic groups most similar to French American Indians are Nicaraguan (36.6%, a difference of 0.020%), Subsaharan African (36.7%, a difference of 0.14%), Cherokee (36.7%, a difference of 0.19%), Immigrants from Senegal (36.7%, a difference of 0.24%), and Central American (36.7%, a difference of 0.31%).
| Demographics | Rating | Rank | Births to Unmarried Women |
| Chickasaw | 0.2 /100 | #255 | Tragic 36.3% |
| Immigrants | Trinidad and Tobago | 0.2 /100 | #256 | Tragic 36.3% |
| Immigrants | Grenada | 0.2 /100 | #257 | Tragic 36.3% |
| Americans | 0.2 /100 | #258 | Tragic 36.4% |
| Immigrants | El Salvador | 0.2 /100 | #259 | Tragic 36.4% |
| Ottawa | 0.2 /100 | #260 | Tragic 36.5% |
| Trinidadians and Tobagonians | 0.2 /100 | #261 | Tragic 36.5% |
| French American Indians | 0.1 /100 | #262 | Tragic 36.6% |
| Nicaraguans | 0.1 /100 | #263 | Tragic 36.6% |
| Sub-Saharan Africans | 0.1 /100 | #264 | Tragic 36.7% |
| Cherokee | 0.1 /100 | #265 | Tragic 36.7% |
| Immigrants | Senegal | 0.1 /100 | #266 | Tragic 36.7% |
| Central Americans | 0.1 /100 | #267 | Tragic 36.7% |
| Comanche | 0.1 /100 | #268 | Tragic 36.7% |
| Senegalese | 0.1 /100 | #269 | Tragic 36.8% |
Demographics Similar to Immigrants from Colombia by Births to Unmarried Women
In terms of births to unmarried women, the demographic groups most similar to Immigrants from Colombia are Samoan (32.6%, a difference of 0.030%), Immigrants (32.7%, a difference of 0.15%), Costa Rican (32.7%, a difference of 0.20%), Immigrants from Thailand (32.8%, a difference of 0.40%), and Immigrants from Germany (32.8%, a difference of 0.42%).
| Demographics | Rating | Rank | Births to Unmarried Women |
| Immigrants | Kenya | 36.9 /100 | #189 | Fair 32.1% |
| Tlingit-Haida | 32.6 /100 | #190 | Fair 32.2% |
| Irish | 32.4 /100 | #191 | Fair 32.2% |
| Colombians | 31.9 /100 | #192 | Fair 32.2% |
| Fijians | 31.1 /100 | #193 | Fair 32.3% |
| Sudanese | 27.3 /100 | #194 | Fair 32.4% |
| Samoans | 21.9 /100 | #195 | Fair 32.6% |
| Immigrants | Colombia | 21.7 /100 | #196 | Fair 32.6% |
| Immigrants | Immigrants | 20.6 /100 | #197 | Fair 32.7% |
| Costa Ricans | 20.3 /100 | #198 | Fair 32.7% |
| Immigrants | Thailand | 18.9 /100 | #199 | Poor 32.8% |
| Immigrants | Germany | 18.8 /100 | #200 | Poor 32.8% |
| Immigrants | Burma/Myanmar | 16.7 /100 | #201 | Poor 32.9% |
| Immigrants | Micronesia | 16.6 /100 | #202 | Poor 32.9% |
| Ute | 14.4 /100 | #203 | Poor 33.0% |