Filipino vs Immigrants from North America Family Households
COMPARE
Filipino
Immigrants from North America
Family Households
Family Households Comparison
Filipinos
Immigrants from North America
65.9%
FAMILY HOUSEHOLDS
99.9/ 100
METRIC RATING
67th/ 347
METRIC RANK
64.0%
FAMILY HOUSEHOLDS
20.0/ 100
METRIC RATING
195th/ 347
METRIC RANK
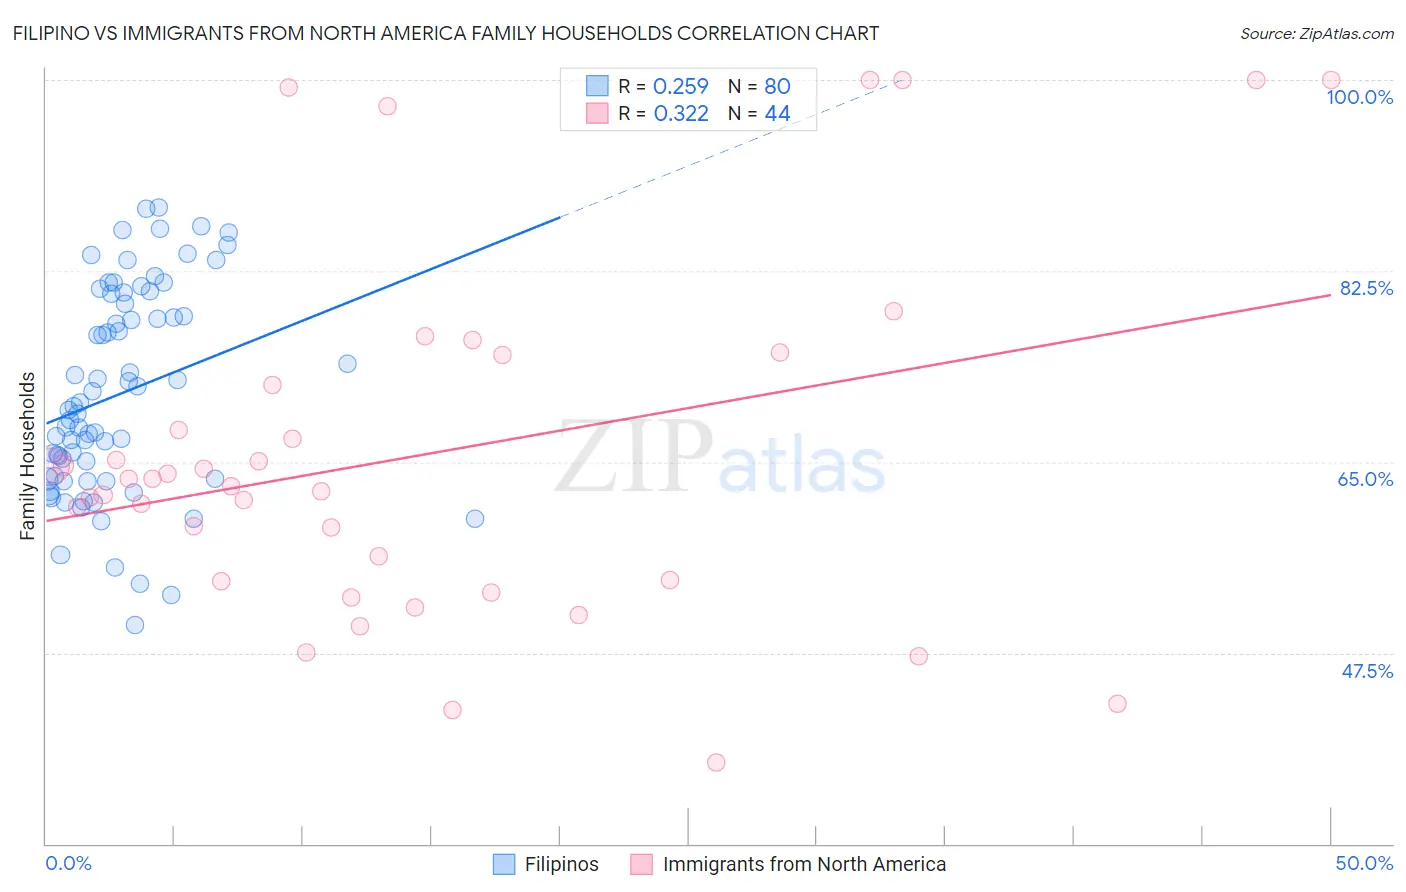
Filipino vs Immigrants from North America Family Households Correlation Chart
The statistical analysis conducted on geographies consisting of 254,177,261 people shows a weak positive correlation between the proportion of Filipinos and percentage of family households in the United States with a correlation coefficient (R) of 0.259 and weighted average of 65.9%. Similarly, the statistical analysis conducted on geographies consisting of 462,193,298 people shows a mild positive correlation between the proportion of Immigrants from North America and percentage of family households in the United States with a correlation coefficient (R) of 0.322 and weighted average of 64.0%, a difference of 3.0%.
Family Households Correlation Summary
| Measurement | Filipino | Immigrants from North America |
| Minimum | 50.0% | 37.5% |
| Maximum | 88.3% | 100.0% |
| Range | 38.3% | 62.5% |
| Mean | 71.2% | 65.7% |
| Median | 69.9% | 63.1% |
| Interquartile 25% (IQ1) | 63.5% | 54.1% |
| Interquartile 75% (IQ3) | 80.0% | 73.4% |
| Interquartile Range (IQR) | 16.5% | 19.3% |
| Standard Deviation (Sample) | 9.4% | 16.4% |
| Standard Deviation (Population) | 9.4% | 16.2% |
Similar Demographics by Family Households
Demographics Similar to Filipinos by Family Households
In terms of family households, the demographic groups most similar to Filipinos are Fijian (65.9%, a difference of 0.0%), Japanese (65.9%, a difference of 0.020%), Costa Rican (65.9%, a difference of 0.040%), Pima (65.9%, a difference of 0.050%), and Malaysian (65.9%, a difference of 0.050%).
| Demographics | Rating | Rank | Family Households |
| South Americans | 100.0 /100 | #60 | Exceptional 66.0% |
| Danes | 100.0 /100 | #61 | Exceptional 66.0% |
| Central Americans | 100.0 /100 | #62 | Exceptional 66.0% |
| Immigrants | Indonesia | 100.0 /100 | #63 | Exceptional 66.0% |
| Pima | 99.9 /100 | #64 | Exceptional 65.9% |
| Costa Ricans | 99.9 /100 | #65 | Exceptional 65.9% |
| Fijians | 99.9 /100 | #66 | Exceptional 65.9% |
| Filipinos | 99.9 /100 | #67 | Exceptional 65.9% |
| Japanese | 99.9 /100 | #68 | Exceptional 65.9% |
| Malaysians | 99.9 /100 | #69 | Exceptional 65.9% |
| Immigrants | Afghanistan | 99.9 /100 | #70 | Exceptional 65.9% |
| Bhutanese | 99.9 /100 | #71 | Exceptional 65.9% |
| Portuguese | 99.9 /100 | #72 | Exceptional 65.8% |
| Laotians | 99.9 /100 | #73 | Exceptional 65.8% |
| Burmese | 99.9 /100 | #74 | Exceptional 65.7% |
Demographics Similar to Immigrants from North America by Family Households
In terms of family households, the demographic groups most similar to Immigrants from North America are Immigrants from Canada (64.0%, a difference of 0.020%), Seminole (64.0%, a difference of 0.020%), Polish (64.0%, a difference of 0.020%), Slavic (64.0%, a difference of 0.030%), and Paiute (64.0%, a difference of 0.040%).
| Demographics | Rating | Rank | Family Households |
| Paraguayans | 26.7 /100 | #188 | Fair 64.1% |
| Immigrants | Western Asia | 25.3 /100 | #189 | Fair 64.1% |
| Zimbabweans | 24.7 /100 | #190 | Fair 64.1% |
| Arabs | 24.5 /100 | #191 | Fair 64.1% |
| Lithuanians | 23.8 /100 | #192 | Fair 64.0% |
| French | 23.7 /100 | #193 | Fair 64.0% |
| Paiute | 22.2 /100 | #194 | Fair 64.0% |
| Immigrants | North America | 20.0 /100 | #195 | Poor 64.0% |
| Immigrants | Canada | 19.2 /100 | #196 | Poor 64.0% |
| Seminole | 18.9 /100 | #197 | Poor 64.0% |
| Poles | 18.9 /100 | #198 | Poor 64.0% |
| Slavs | 18.6 /100 | #199 | Poor 64.0% |
| Immigrants | Malaysia | 17.9 /100 | #200 | Poor 64.0% |
| Immigrants | Eastern Europe | 17.2 /100 | #201 | Poor 64.0% |
| Iranians | 13.5 /100 | #202 | Poor 63.9% |