Fijian vs Uruguayan Currently Married
COMPARE
Fijian
Uruguayan
Currently Married
Currently Married Comparison
Fijians
Uruguayans
46.3%
CURRENTLY MARRIED
30.3/ 100
METRIC RATING
189th/ 347
METRIC RANK
45.6%
CURRENTLY MARRIED
7.9/ 100
METRIC RATING
210th/ 347
METRIC RANK
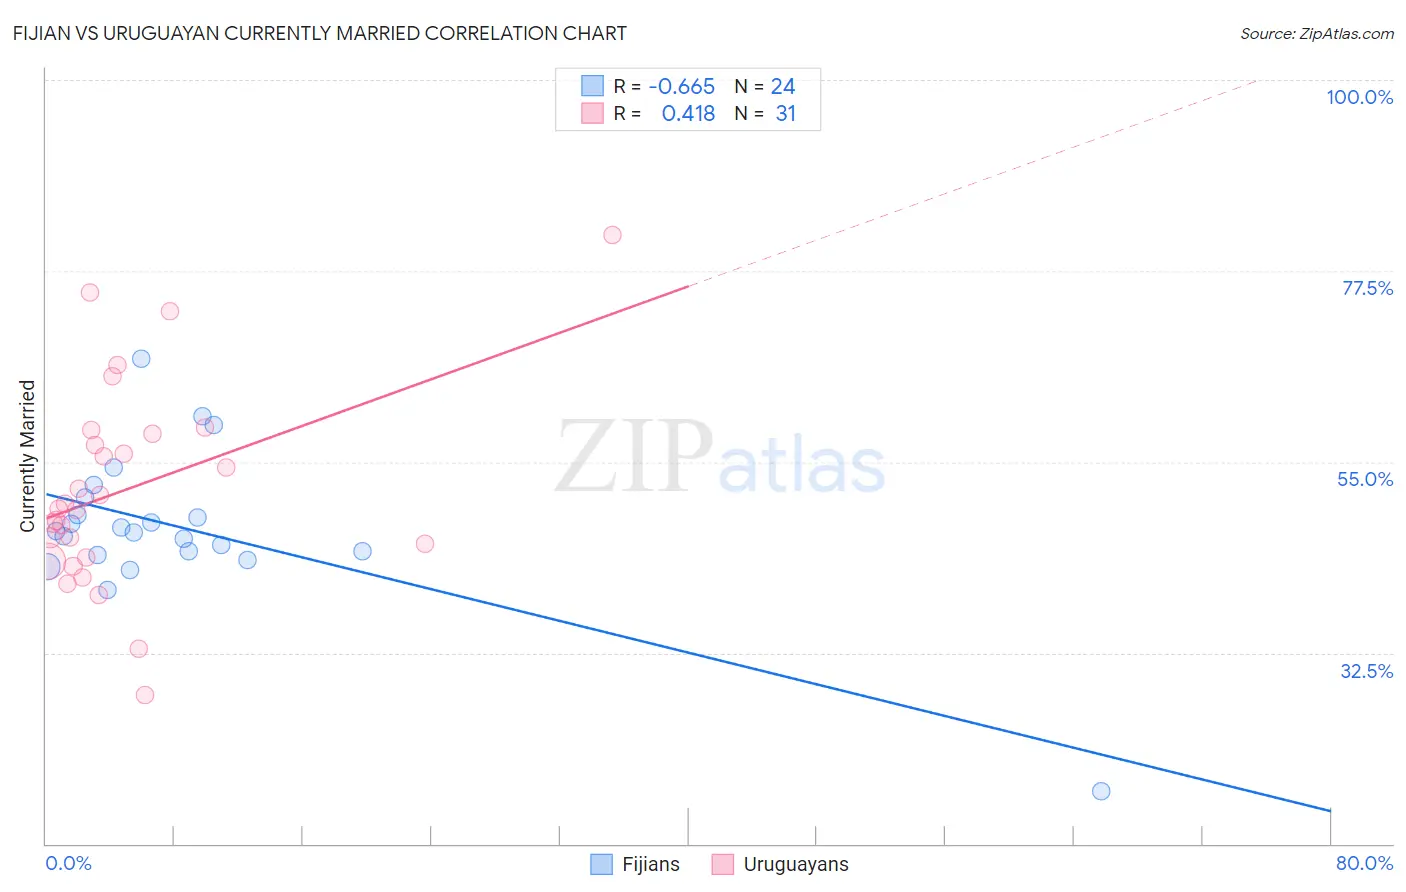
Fijian vs Uruguayan Currently Married Correlation Chart
The statistical analysis conducted on geographies consisting of 55,948,768 people shows a significant negative correlation between the proportion of Fijians and percentage of population currently married in the United States with a correlation coefficient (R) of -0.665 and weighted average of 46.3%. Similarly, the statistical analysis conducted on geographies consisting of 144,776,099 people shows a moderate positive correlation between the proportion of Uruguayans and percentage of population currently married in the United States with a correlation coefficient (R) of 0.418 and weighted average of 45.6%, a difference of 1.5%.
Currently Married Correlation Summary
| Measurement | Fijian | Uruguayan |
| Minimum | 16.2% | 27.6% |
| Maximum | 67.1% | 81.8% |
| Range | 50.9% | 54.2% |
| Mean | 47.2% | 51.8% |
| Median | 46.8% | 49.5% |
| Interquartile 25% (IQ1) | 44.2% | 43.7% |
| Interquartile 75% (IQ3) | 49.8% | 58.2% |
| Interquartile Range (IQR) | 5.5% | 14.6% |
| Standard Deviation (Sample) | 9.1% | 11.8% |
| Standard Deviation (Population) | 8.9% | 11.6% |
Similar Demographics by Currently Married
Demographics Similar to Fijians by Currently Married
In terms of currently married, the demographic groups most similar to Fijians are Choctaw (46.3%, a difference of 0.050%), Colombian (46.3%, a difference of 0.060%), Immigrants from France (46.2%, a difference of 0.12%), Immigrants from Peru (46.4%, a difference of 0.21%), and Soviet Union (46.2%, a difference of 0.21%).
| Demographics | Rating | Rank | Currently Married |
| Potawatomi | 41.9 /100 | #182 | Average 46.5% |
| Immigrants | Northern Africa | 39.7 /100 | #183 | Fair 46.5% |
| Brazilians | 39.3 /100 | #184 | Fair 46.4% |
| Mongolians | 37.6 /100 | #185 | Fair 46.4% |
| Immigrants | Chile | 36.8 /100 | #186 | Fair 46.4% |
| Immigrants | Peru | 35.3 /100 | #187 | Fair 46.4% |
| Colombians | 31.8 /100 | #188 | Fair 46.3% |
| Fijians | 30.3 /100 | #189 | Fair 46.3% |
| Choctaw | 29.1 /100 | #190 | Fair 46.3% |
| Immigrants | France | 27.7 /100 | #191 | Fair 46.2% |
| Soviet Union | 25.7 /100 | #192 | Fair 46.2% |
| Immigrants | Fiji | 25.0 /100 | #193 | Fair 46.2% |
| South Americans | 23.8 /100 | #194 | Fair 46.1% |
| Immigrants | Nepal | 23.7 /100 | #195 | Fair 46.1% |
| Immigrants | Bosnia and Herzegovina | 22.2 /100 | #196 | Fair 46.1% |
Demographics Similar to Uruguayans by Currently Married
In terms of currently married, the demographic groups most similar to Uruguayans are Houma (45.5%, a difference of 0.090%), Marshallese (45.5%, a difference of 0.090%), Immigrants from Micronesia (45.6%, a difference of 0.11%), Alaska Native (45.5%, a difference of 0.12%), and Dutch West Indian (45.5%, a difference of 0.16%).
| Demographics | Rating | Rank | Currently Married |
| Taiwanese | 11.7 /100 | #203 | Poor 45.8% |
| Immigrants | Spain | 11.6 /100 | #204 | Poor 45.8% |
| South American Indians | 11.5 /100 | #205 | Poor 45.8% |
| Immigrants | Immigrants | 11.2 /100 | #206 | Poor 45.8% |
| Immigrants | South America | 10.8 /100 | #207 | Poor 45.7% |
| Alsatians | 10.8 /100 | #208 | Poor 45.7% |
| Immigrants | Micronesia | 8.8 /100 | #209 | Tragic 45.6% |
| Uruguayans | 7.9 /100 | #210 | Tragic 45.6% |
| Houma | 7.2 /100 | #211 | Tragic 45.5% |
| Marshallese | 7.2 /100 | #212 | Tragic 45.5% |
| Alaska Natives | 7.0 /100 | #213 | Tragic 45.5% |
| Dutch West Indians | 6.7 /100 | #214 | Tragic 45.5% |
| German Russians | 6.7 /100 | #215 | Tragic 45.5% |
| Immigrants | Morocco | 5.5 /100 | #216 | Tragic 45.4% |
| Immigrants | Thailand | 5.1 /100 | #217 | Tragic 45.4% |