Fijian vs Spanish American Currently Married
COMPARE
Fijian
Spanish American
Currently Married
Currently Married Comparison
Fijians
Spanish Americans
46.3%
CURRENTLY MARRIED
30.3/ 100
METRIC RATING
189th/ 347
METRIC RANK
45.0%
CURRENTLY MARRIED
2.1/ 100
METRIC RATING
227th/ 347
METRIC RANK
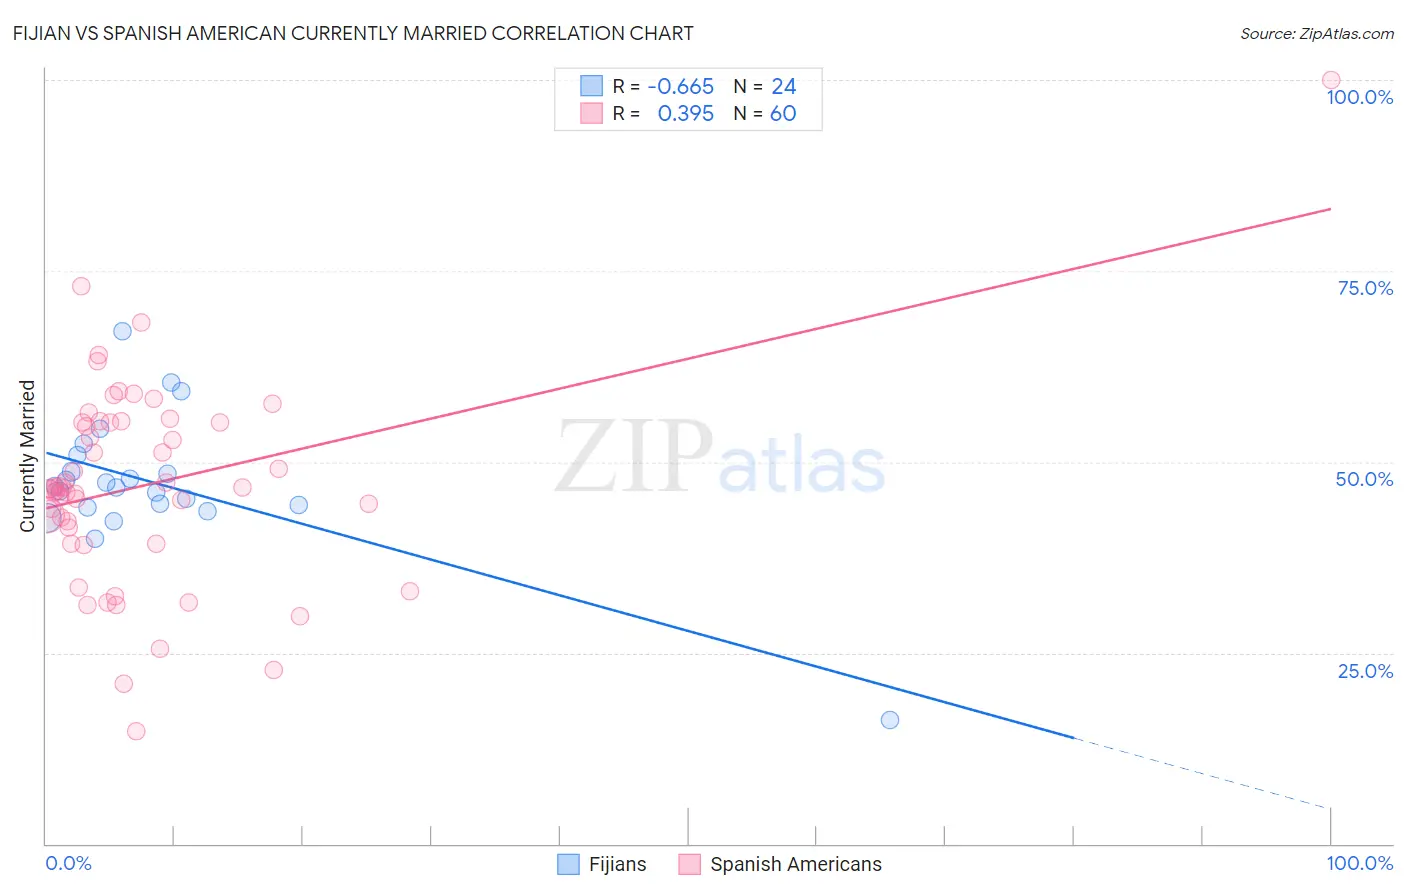
Fijian vs Spanish American Currently Married Correlation Chart
The statistical analysis conducted on geographies consisting of 55,948,768 people shows a significant negative correlation between the proportion of Fijians and percentage of population currently married in the United States with a correlation coefficient (R) of -0.665 and weighted average of 46.3%. Similarly, the statistical analysis conducted on geographies consisting of 103,168,407 people shows a mild positive correlation between the proportion of Spanish Americans and percentage of population currently married in the United States with a correlation coefficient (R) of 0.395 and weighted average of 45.0%, a difference of 2.9%.
Currently Married Correlation Summary
| Measurement | Fijian | Spanish American |
| Minimum | 16.2% | 14.8% |
| Maximum | 67.1% | 100.0% |
| Range | 50.9% | 85.2% |
| Mean | 47.2% | 47.0% |
| Median | 46.8% | 46.6% |
| Interquartile 25% (IQ1) | 44.2% | 40.4% |
| Interquartile 75% (IQ3) | 49.8% | 55.2% |
| Interquartile Range (IQR) | 5.5% | 14.8% |
| Standard Deviation (Sample) | 9.1% | 13.5% |
| Standard Deviation (Population) | 8.9% | 13.4% |
Similar Demographics by Currently Married
Demographics Similar to Fijians by Currently Married
In terms of currently married, the demographic groups most similar to Fijians are Choctaw (46.3%, a difference of 0.050%), Colombian (46.3%, a difference of 0.060%), Immigrants from France (46.2%, a difference of 0.12%), Immigrants from Peru (46.4%, a difference of 0.21%), and Soviet Union (46.2%, a difference of 0.21%).
| Demographics | Rating | Rank | Currently Married |
| Potawatomi | 41.9 /100 | #182 | Average 46.5% |
| Immigrants | Northern Africa | 39.7 /100 | #183 | Fair 46.5% |
| Brazilians | 39.3 /100 | #184 | Fair 46.4% |
| Mongolians | 37.6 /100 | #185 | Fair 46.4% |
| Immigrants | Chile | 36.8 /100 | #186 | Fair 46.4% |
| Immigrants | Peru | 35.3 /100 | #187 | Fair 46.4% |
| Colombians | 31.8 /100 | #188 | Fair 46.3% |
| Fijians | 30.3 /100 | #189 | Fair 46.3% |
| Choctaw | 29.1 /100 | #190 | Fair 46.3% |
| Immigrants | France | 27.7 /100 | #191 | Fair 46.2% |
| Soviet Union | 25.7 /100 | #192 | Fair 46.2% |
| Immigrants | Fiji | 25.0 /100 | #193 | Fair 46.2% |
| South Americans | 23.8 /100 | #194 | Fair 46.1% |
| Immigrants | Nepal | 23.7 /100 | #195 | Fair 46.1% |
| Immigrants | Bosnia and Herzegovina | 22.2 /100 | #196 | Fair 46.1% |
Demographics Similar to Spanish Americans by Currently Married
In terms of currently married, the demographic groups most similar to Spanish Americans are Comanche (45.0%, a difference of 0.0%), Immigrants from Uruguay (45.0%, a difference of 0.0%), French American Indian (45.0%, a difference of 0.050%), Immigrants from Uganda (45.0%, a difference of 0.060%), and Immigrants from Laos (45.0%, a difference of 0.10%).
| Demographics | Rating | Rank | Currently Married |
| Kenyans | 3.1 /100 | #220 | Tragic 45.2% |
| Mexicans | 3.0 /100 | #221 | Tragic 45.2% |
| Immigrants | Azores | 2.5 /100 | #222 | Tragic 45.1% |
| Immigrants | Laos | 2.3 /100 | #223 | Tragic 45.0% |
| Immigrants | Uganda | 2.2 /100 | #224 | Tragic 45.0% |
| French American Indians | 2.2 /100 | #225 | Tragic 45.0% |
| Comanche | 2.1 /100 | #226 | Tragic 45.0% |
| Spanish Americans | 2.1 /100 | #227 | Tragic 45.0% |
| Immigrants | Uruguay | 2.0 /100 | #228 | Tragic 45.0% |
| Cree | 1.7 /100 | #229 | Tragic 44.9% |
| Immigrants | Kenya | 1.6 /100 | #230 | Tragic 44.9% |
| Immigrants | Panama | 1.5 /100 | #231 | Tragic 44.9% |
| Nepalese | 1.2 /100 | #232 | Tragic 44.7% |
| Immigrants | Saudi Arabia | 1.1 /100 | #233 | Tragic 44.7% |
| Iroquois | 1.1 /100 | #234 | Tragic 44.7% |