Immigrants from St. Vincent and the Grenadines vs Immigrants from Bosnia and Herzegovina Average Family Size
COMPARE
Immigrants from St. Vincent and the Grenadines
Immigrants from Bosnia and Herzegovina
Average Family Size
Average Family Size Comparison
Immigrants from St. Vincent and the Grenadines
Immigrants from Bosnia and Herzegovina
3.34
AVERAGE FAMILY SIZE
99.9/ 100
METRIC RATING
66th/ 347
METRIC RANK
3.15
AVERAGE FAMILY SIZE
0.5/ 100
METRIC RATING
276th/ 347
METRIC RANK
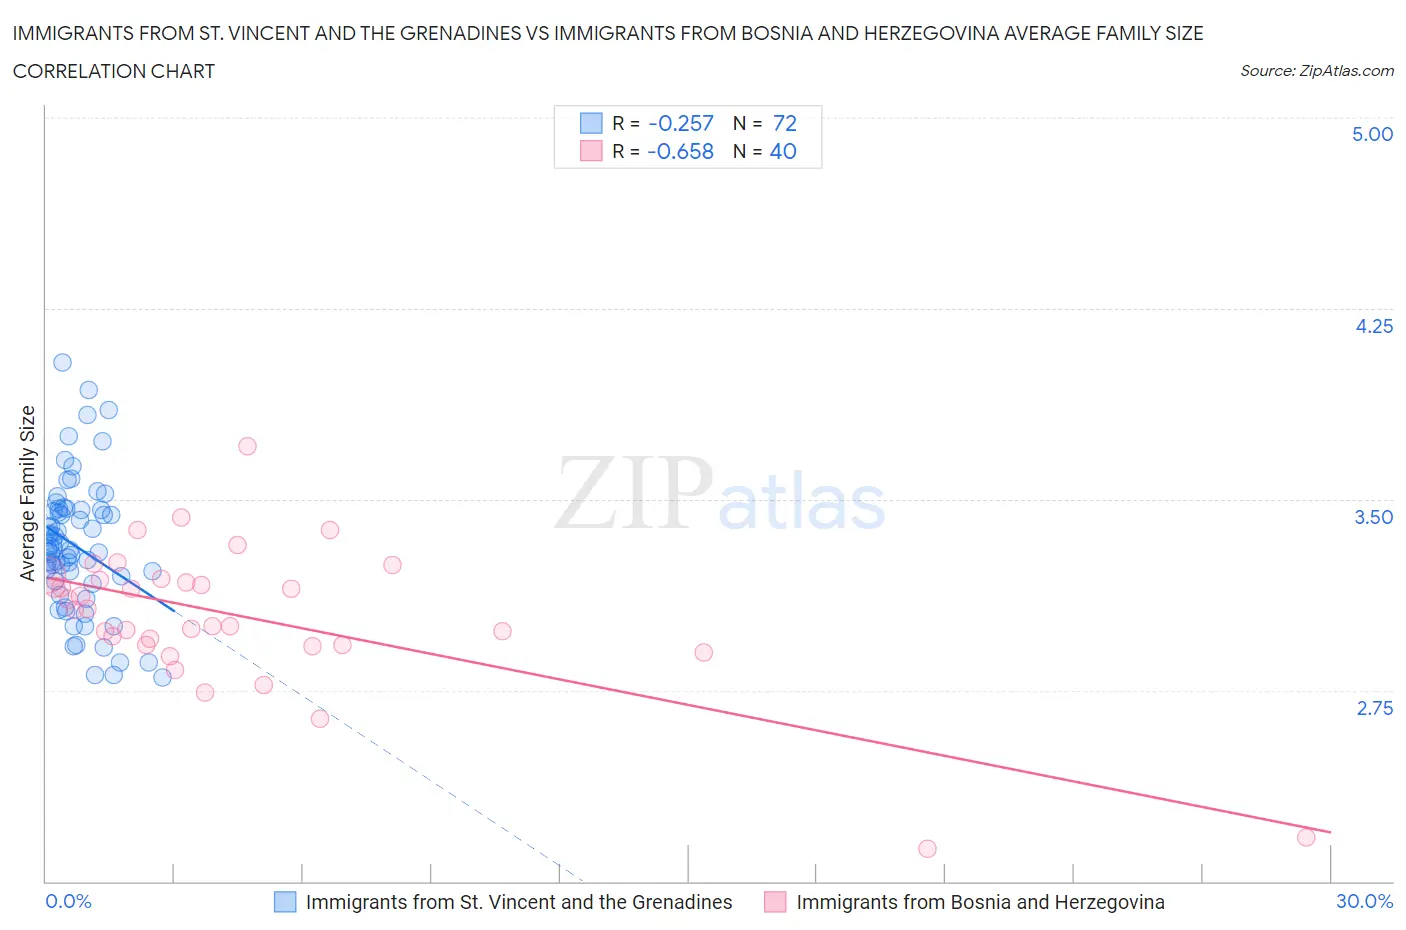
Immigrants from St. Vincent and the Grenadines vs Immigrants from Bosnia and Herzegovina Average Family Size Correlation Chart
The statistical analysis conducted on geographies consisting of 56,188,242 people shows a weak negative correlation between the proportion of Immigrants from St. Vincent and the Grenadines and average family size in the United States with a correlation coefficient (R) of -0.257 and weighted average of 3.34. Similarly, the statistical analysis conducted on geographies consisting of 156,805,510 people shows a significant negative correlation between the proportion of Immigrants from Bosnia and Herzegovina and average family size in the United States with a correlation coefficient (R) of -0.658 and weighted average of 3.15, a difference of 5.9%.
Average Family Size Correlation Summary
| Measurement | Immigrants from St. Vincent and the Grenadines | Immigrants from Bosnia and Herzegovina |
| Minimum | 2.80 | 2.13 |
| Maximum | 4.04 | 3.71 |
| Range | 1.24 | 1.58 |
| Mean | 3.31 | 3.04 |
| Median | 3.30 | 3.07 |
| Interquartile 25% (IQ1) | 3.18 | 2.93 |
| Interquartile 75% (IQ3) | 3.46 | 3.19 |
| Interquartile Range (IQR) | 0.28 | 0.26 |
| Standard Deviation (Sample) | 0.26 | 0.29 |
| Standard Deviation (Population) | 0.26 | 0.29 |
Similar Demographics by Average Family Size
Demographics Similar to Immigrants from St. Vincent and the Grenadines by Average Family Size
In terms of average family size, the demographic groups most similar to Immigrants from St. Vincent and the Grenadines are Immigrants from Jamaica (3.33, a difference of 0.040%), Immigrants from Laos (3.34, a difference of 0.060%), Dominican (3.34, a difference of 0.080%), Immigrants from Cambodia (3.33, a difference of 0.12%), and Chinese (3.34, a difference of 0.15%).
| Demographics | Rating | Rank | Average Family Size |
| Japanese | 100.0 /100 | #59 | Exceptional 3.35 |
| Immigrants | Armenia | 100.0 /100 | #60 | Exceptional 3.35 |
| Central American Indians | 100.0 /100 | #61 | Exceptional 3.35 |
| Immigrants | Grenada | 100.0 /100 | #62 | Exceptional 3.34 |
| Chinese | 100.0 /100 | #63 | Exceptional 3.34 |
| Dominicans | 99.9 /100 | #64 | Exceptional 3.34 |
| Immigrants | Laos | 99.9 /100 | #65 | Exceptional 3.34 |
| Immigrants | St. Vincent and the Grenadines | 99.9 /100 | #66 | Exceptional 3.34 |
| Immigrants | Jamaica | 99.9 /100 | #67 | Exceptional 3.33 |
| Immigrants | Cambodia | 99.9 /100 | #68 | Exceptional 3.33 |
| Immigrants | Immigrants | 99.9 /100 | #69 | Exceptional 3.33 |
| Immigrants | Trinidad and Tobago | 99.9 /100 | #70 | Exceptional 3.33 |
| Immigrants | West Indies | 99.9 /100 | #71 | Exceptional 3.33 |
| Immigrants | Caribbean | 99.9 /100 | #72 | Exceptional 3.33 |
| Yaqui | 99.9 /100 | #73 | Exceptional 3.32 |
Demographics Similar to Immigrants from Bosnia and Herzegovina by Average Family Size
In terms of average family size, the demographic groups most similar to Immigrants from Bosnia and Herzegovina are Swiss (3.15, a difference of 0.010%), Okinawan (3.15, a difference of 0.040%), Immigrants from Europe (3.15, a difference of 0.060%), Immigrants from Belgium (3.15, a difference of 0.080%), and Cambodian (3.15, a difference of 0.080%).
| Demographics | Rating | Rank | Average Family Size |
| Immigrants | Singapore | 0.7 /100 | #269 | Tragic 3.16 |
| Tlingit-Haida | 0.7 /100 | #270 | Tragic 3.16 |
| Immigrants | Germany | 0.7 /100 | #271 | Tragic 3.15 |
| Immigrants | Lithuania | 0.6 /100 | #272 | Tragic 3.15 |
| New Zealanders | 0.6 /100 | #273 | Tragic 3.15 |
| Immigrants | Belgium | 0.6 /100 | #274 | Tragic 3.15 |
| Cambodians | 0.6 /100 | #275 | Tragic 3.15 |
| Immigrants | Bosnia and Herzegovina | 0.5 /100 | #276 | Tragic 3.15 |
| Swiss | 0.5 /100 | #277 | Tragic 3.15 |
| Okinawans | 0.5 /100 | #278 | Tragic 3.15 |
| Immigrants | Europe | 0.5 /100 | #279 | Tragic 3.15 |
| Immigrants | England | 0.4 /100 | #280 | Tragic 3.15 |
| Immigrants | Denmark | 0.4 /100 | #281 | Tragic 3.15 |
| Yugoslavians | 0.4 /100 | #282 | Tragic 3.15 |
| German Russians | 0.4 /100 | #283 | Tragic 3.15 |