Estonian vs Immigrants from Middle Africa Family Households with Children
COMPARE
Estonian
Immigrants from Middle Africa
Family Households with Children
Family Households with Children Comparison
Estonians
Immigrants from Middle Africa
26.1%
FAMILY HOUSEHOLDS WITH CHILDREN
0.0/ 100
METRIC RATING
316th/ 347
METRIC RANK
28.0%
FAMILY HOUSEHOLDS WITH CHILDREN
97.0/ 100
METRIC RATING
112th/ 347
METRIC RANK
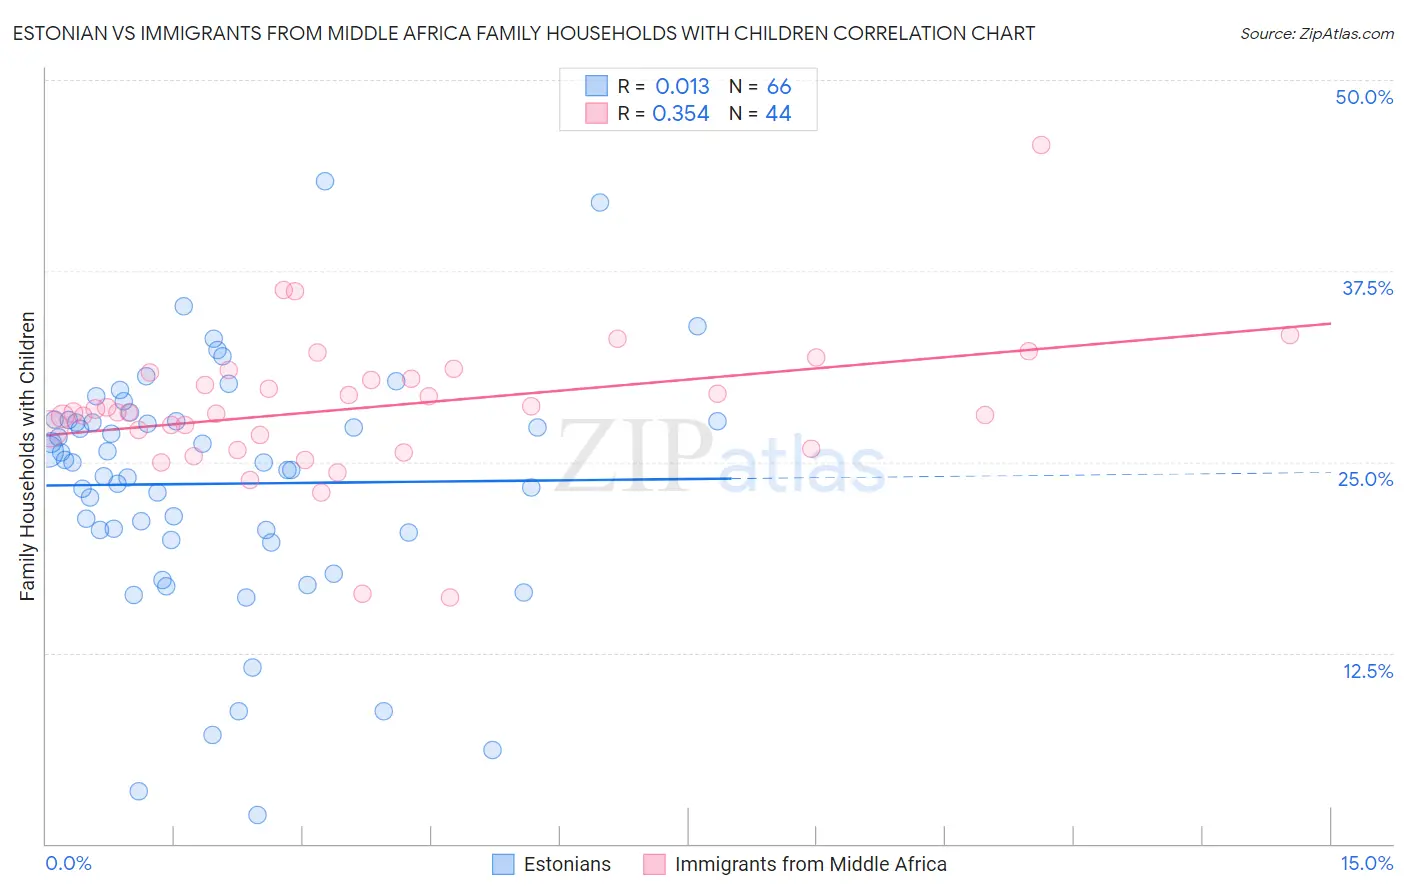
Estonian vs Immigrants from Middle Africa Family Households with Children Correlation Chart
The statistical analysis conducted on geographies consisting of 123,477,071 people shows no correlation between the proportion of Estonians and percentage of family households with children in the United States with a correlation coefficient (R) of 0.013 and weighted average of 26.1%. Similarly, the statistical analysis conducted on geographies consisting of 202,619,096 people shows a mild positive correlation between the proportion of Immigrants from Middle Africa and percentage of family households with children in the United States with a correlation coefficient (R) of 0.354 and weighted average of 28.0%, a difference of 7.2%.
Family Households with Children Correlation Summary
| Measurement | Estonian | Immigrants from Middle Africa |
| Minimum | 1.9% | 16.1% |
| Maximum | 43.3% | 45.8% |
| Range | 41.4% | 29.7% |
| Mean | 23.6% | 28.6% |
| Median | 25.0% | 28.2% |
| Interquartile 25% (IQ1) | 20.4% | 26.3% |
| Interquartile 75% (IQ3) | 27.7% | 30.7% |
| Interquartile Range (IQR) | 7.3% | 4.3% |
| Standard Deviation (Sample) | 8.0% | 4.7% |
| Standard Deviation (Population) | 7.9% | 4.7% |
Similar Demographics by Family Households with Children
Demographics Similar to Estonians by Family Households with Children
In terms of family households with children, the demographic groups most similar to Estonians are Immigrants from Norway (26.1%, a difference of 0.080%), Ottawa (26.1%, a difference of 0.090%), Iroquois (26.1%, a difference of 0.13%), French Canadian (26.1%, a difference of 0.15%), and Immigrants from France (26.0%, a difference of 0.22%).
| Demographics | Rating | Rank | Family Households with Children |
| Immigrants | Somalia | 0.0 /100 | #309 | Tragic 26.3% |
| Marshallese | 0.0 /100 | #310 | Tragic 26.2% |
| Colville | 0.0 /100 | #311 | Tragic 26.2% |
| Immigrants | Czechoslovakia | 0.0 /100 | #312 | Tragic 26.2% |
| Cree | 0.0 /100 | #313 | Tragic 26.2% |
| French Canadians | 0.0 /100 | #314 | Tragic 26.1% |
| Immigrants | Norway | 0.0 /100 | #315 | Tragic 26.1% |
| Estonians | 0.0 /100 | #316 | Tragic 26.1% |
| Ottawa | 0.0 /100 | #317 | Tragic 26.1% |
| Iroquois | 0.0 /100 | #318 | Tragic 26.1% |
| Immigrants | France | 0.0 /100 | #319 | Tragic 26.0% |
| Tlingit-Haida | 0.0 /100 | #320 | Tragic 26.0% |
| British West Indians | 0.0 /100 | #321 | Tragic 26.0% |
| Immigrants | Greece | 0.0 /100 | #322 | Tragic 26.0% |
| Immigrants | Australia | 0.0 /100 | #323 | Tragic 26.0% |
Demographics Similar to Immigrants from Middle Africa by Family Households with Children
In terms of family households with children, the demographic groups most similar to Immigrants from Middle Africa are Arab (28.0%, a difference of 0.010%), Scandinavian (28.0%, a difference of 0.030%), South American Indian (28.0%, a difference of 0.030%), Immigrants from Africa (28.0%, a difference of 0.040%), and Spaniard (28.0%, a difference of 0.090%).
| Demographics | Rating | Rank | Family Households with Children |
| Choctaw | 98.3 /100 | #105 | Exceptional 28.1% |
| Immigrants | South America | 98.0 /100 | #106 | Exceptional 28.0% |
| Immigrants | Uganda | 97.7 /100 | #107 | Exceptional 28.0% |
| Immigrants | Burma/Myanmar | 97.7 /100 | #108 | Exceptional 28.0% |
| Tohono O'odham | 97.6 /100 | #109 | Exceptional 28.0% |
| Spaniards | 97.4 /100 | #110 | Exceptional 28.0% |
| Scandinavians | 97.1 /100 | #111 | Exceptional 28.0% |
| Immigrants | Middle Africa | 97.0 /100 | #112 | Exceptional 28.0% |
| Arabs | 97.0 /100 | #113 | Exceptional 28.0% |
| South American Indians | 96.9 /100 | #114 | Exceptional 28.0% |
| Immigrants | Africa | 96.8 /100 | #115 | Exceptional 28.0% |
| Pakistanis | 96.0 /100 | #116 | Exceptional 27.9% |
| Immigrants | Malaysia | 95.9 /100 | #117 | Exceptional 27.9% |
| Central American Indians | 95.9 /100 | #118 | Exceptional 27.9% |
| Zimbabweans | 95.6 /100 | #119 | Exceptional 27.9% |