English vs Nigerian Family Households with Children
COMPARE
English
Nigerian
Family Households with Children
Family Households with Children Comparison
English
Nigerians
27.3%
FAMILY HOUSEHOLDS WITH CHILDREN
32.0/ 100
METRIC RATING
199th/ 347
METRIC RANK
28.4%
FAMILY HOUSEHOLDS WITH CHILDREN
99.8/ 100
METRIC RATING
77th/ 347
METRIC RANK
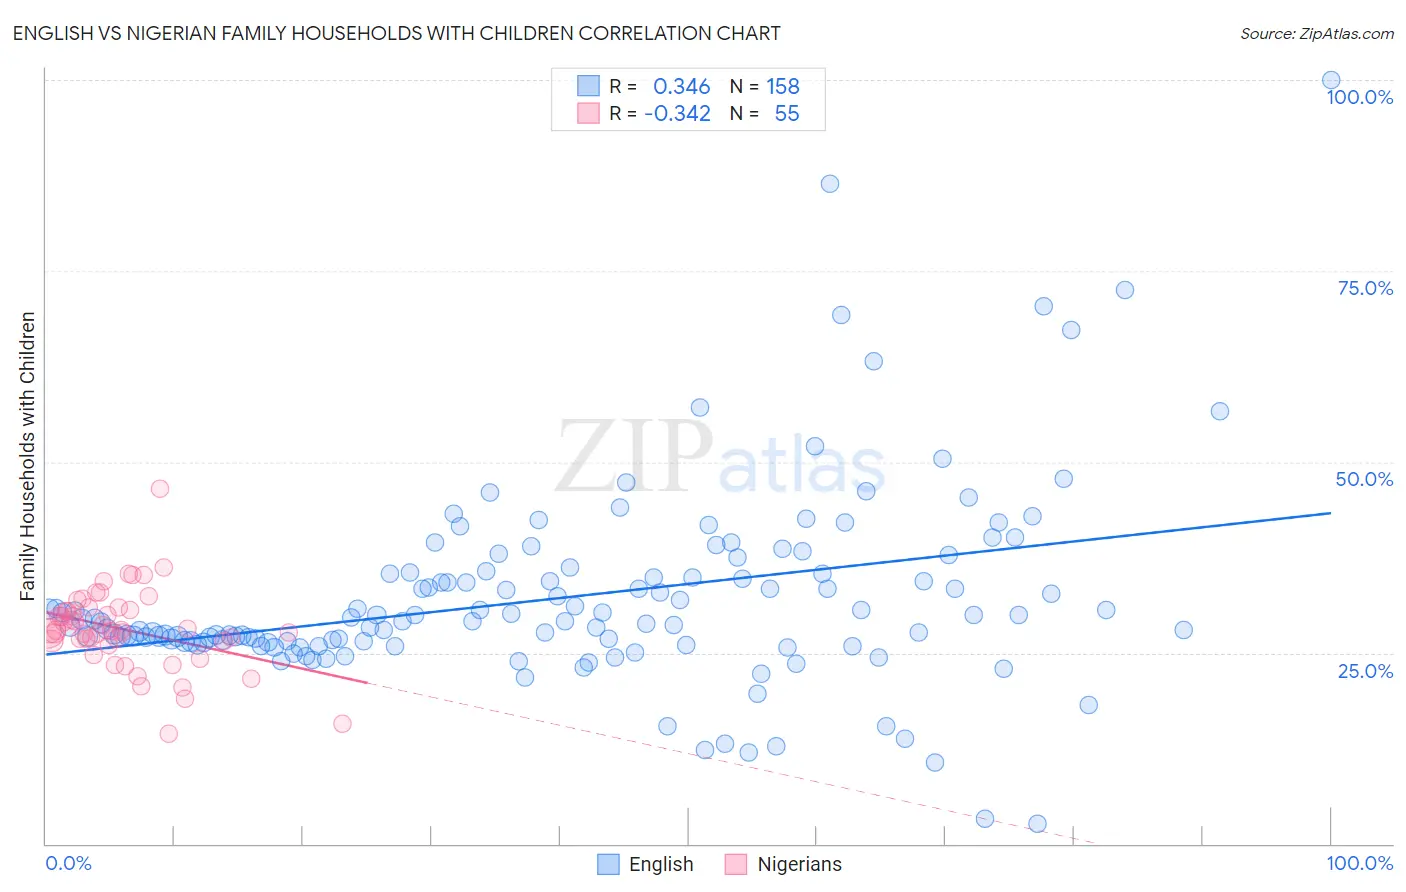
English vs Nigerian Family Households with Children Correlation Chart
The statistical analysis conducted on geographies consisting of 578,706,985 people shows a mild positive correlation between the proportion of English and percentage of family households with children in the United States with a correlation coefficient (R) of 0.346 and weighted average of 27.3%. Similarly, the statistical analysis conducted on geographies consisting of 332,387,901 people shows a mild negative correlation between the proportion of Nigerians and percentage of family households with children in the United States with a correlation coefficient (R) of -0.342 and weighted average of 28.4%, a difference of 4.0%.
Family Households with Children Correlation Summary
| Measurement | English | Nigerian |
| Minimum | 2.7% | 14.3% |
| Maximum | 100.0% | 46.4% |
| Range | 97.3% | 32.1% |
| Mean | 32.2% | 28.1% |
| Median | 29.2% | 27.9% |
| Interquartile 25% (IQ1) | 26.5% | 26.5% |
| Interquartile 75% (IQ3) | 35.4% | 30.6% |
| Interquartile Range (IQR) | 8.9% | 4.1% |
| Standard Deviation (Sample) | 12.9% | 5.2% |
| Standard Deviation (Population) | 12.9% | 5.2% |
Similar Demographics by Family Households with Children
Demographics Similar to English by Family Households with Children
In terms of family households with children, the demographic groups most similar to English are Immigrants from Romania (27.4%, a difference of 0.060%), Norwegian (27.4%, a difference of 0.070%), Cheyenne (27.4%, a difference of 0.080%), Crow (27.4%, a difference of 0.090%), and Immigrants from Congo (27.3%, a difference of 0.090%).
| Demographics | Rating | Rank | Family Households with Children |
| Pennsylvania Germans | 37.5 /100 | #192 | Fair 27.4% |
| Swedes | 36.9 /100 | #193 | Fair 27.4% |
| Immigrants | Iran | 36.1 /100 | #194 | Fair 27.4% |
| Crow | 35.7 /100 | #195 | Fair 27.4% |
| Cheyenne | 35.1 /100 | #196 | Fair 27.4% |
| Norwegians | 35.0 /100 | #197 | Fair 27.4% |
| Immigrants | Romania | 34.4 /100 | #198 | Fair 27.4% |
| English | 32.0 /100 | #199 | Fair 27.3% |
| Immigrants | Congo | 28.7 /100 | #200 | Fair 27.3% |
| Bhutanese | 25.1 /100 | #201 | Fair 27.3% |
| Americans | 22.8 /100 | #202 | Fair 27.3% |
| Kiowa | 22.2 /100 | #203 | Fair 27.3% |
| Immigrants | Sudan | 21.6 /100 | #204 | Fair 27.3% |
| Immigrants | Haiti | 20.3 /100 | #205 | Fair 27.2% |
| Immigrants | Micronesia | 20.2 /100 | #206 | Fair 27.2% |
Demographics Similar to Nigerians by Family Households with Children
In terms of family households with children, the demographic groups most similar to Nigerians are Immigrants from Nepal (28.4%, a difference of 0.040%), Immigrants from Sri Lanka (28.4%, a difference of 0.050%), Immigrants from Jordan (28.4%, a difference of 0.060%), Immigrants from Iraq (28.4%, a difference of 0.070%), and Native/Alaskan (28.4%, a difference of 0.080%).
| Demographics | Rating | Rank | Family Households with Children |
| Immigrants | Honduras | 99.9 /100 | #70 | Exceptional 28.5% |
| Burmese | 99.9 /100 | #71 | Exceptional 28.5% |
| Immigrants | Indonesia | 99.9 /100 | #72 | Exceptional 28.5% |
| Iraqis | 99.9 /100 | #73 | Exceptional 28.5% |
| Laotians | 99.9 /100 | #74 | Exceptional 28.5% |
| Immigrants | Jordan | 99.9 /100 | #75 | Exceptional 28.4% |
| Immigrants | Sri Lanka | 99.9 /100 | #76 | Exceptional 28.4% |
| Nigerians | 99.8 /100 | #77 | Exceptional 28.4% |
| Immigrants | Nepal | 99.8 /100 | #78 | Exceptional 28.4% |
| Immigrants | Iraq | 99.8 /100 | #79 | Exceptional 28.4% |
| Natives/Alaskans | 99.8 /100 | #80 | Exceptional 28.4% |
| South Americans | 99.8 /100 | #81 | Exceptional 28.4% |
| Kenyans | 99.8 /100 | #82 | Exceptional 28.4% |
| Nicaraguans | 99.8 /100 | #83 | Exceptional 28.4% |
| Costa Ricans | 99.8 /100 | #84 | Exceptional 28.4% |