Chippewa vs Osage Single Father Households
COMPARE
Chippewa
Osage
Single Father Households
Single Father Households Comparison
Chippewa
Osage
3.1%
SINGLE FATHER HOUSEHOLDS
0.0/ 100
METRIC RATING
329th/ 347
METRIC RANK
2.5%
SINGLE FATHER HOUSEHOLDS
4.1/ 100
METRIC RATING
242nd/ 347
METRIC RANK
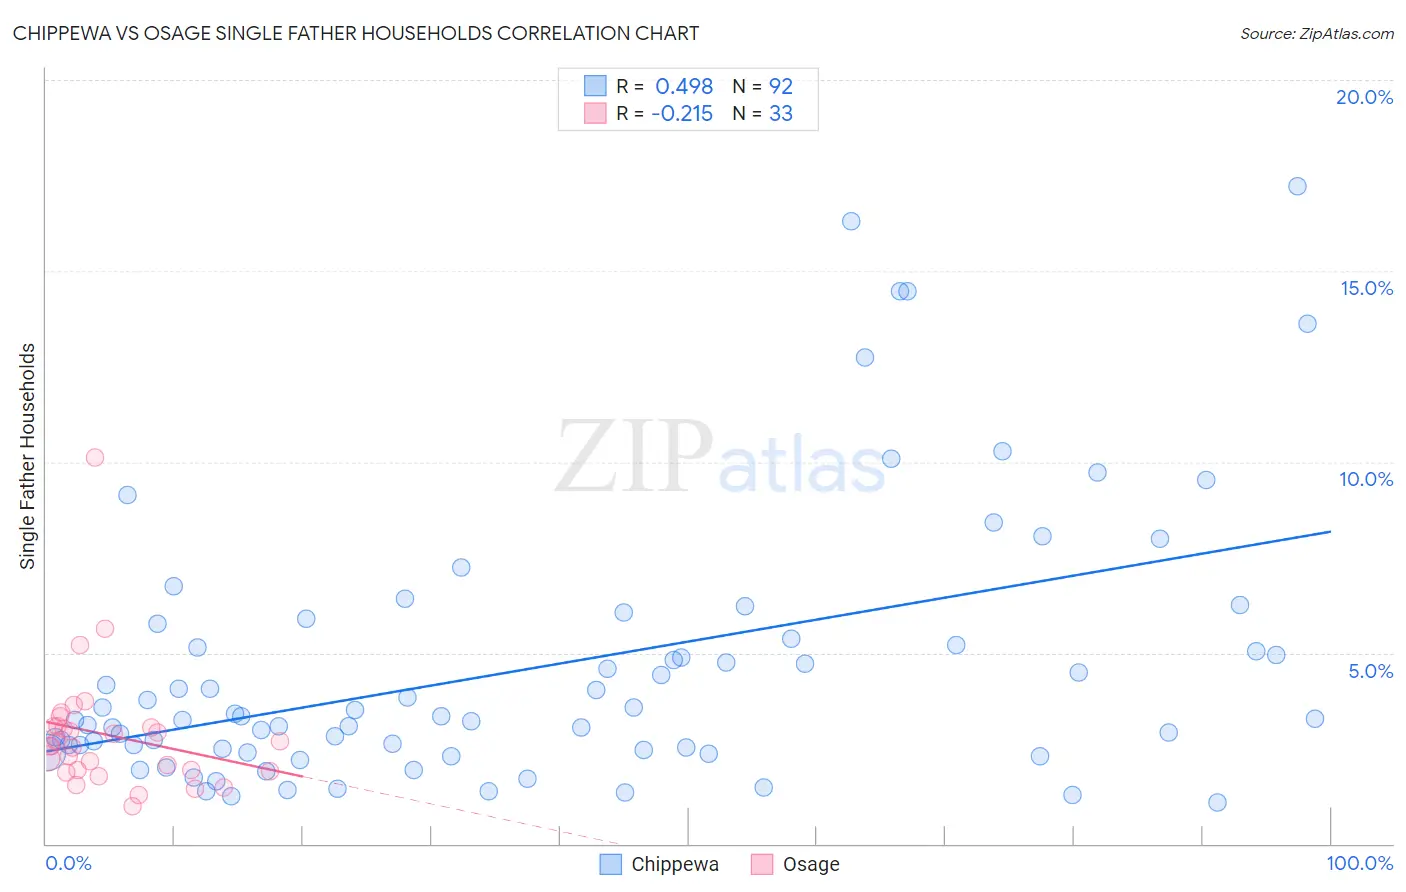
Chippewa vs Osage Single Father Households Correlation Chart
The statistical analysis conducted on geographies consisting of 214,030,064 people shows a moderate positive correlation between the proportion of Chippewa and percentage of single father households in the United States with a correlation coefficient (R) of 0.498 and weighted average of 3.1%. Similarly, the statistical analysis conducted on geographies consisting of 91,601,275 people shows a weak negative correlation between the proportion of Osage and percentage of single father households in the United States with a correlation coefficient (R) of -0.215 and weighted average of 2.5%, a difference of 25.0%.
Single Father Households Correlation Summary
| Measurement | Chippewa | Osage |
| Minimum | 1.1% | 0.98% |
| Maximum | 17.2% | 10.1% |
| Range | 16.1% | 9.2% |
| Mean | 4.6% | 2.8% |
| Median | 3.3% | 2.6% |
| Interquartile 25% (IQ1) | 2.5% | 1.9% |
| Interquartile 75% (IQ3) | 5.3% | 3.1% |
| Interquartile Range (IQR) | 2.8% | 1.2% |
| Standard Deviation (Sample) | 3.5% | 1.6% |
| Standard Deviation (Population) | 3.5% | 1.6% |
Similar Demographics by Single Father Households
Demographics Similar to Chippewa by Single Father Households
In terms of single father households, the demographic groups most similar to Chippewa are Immigrants from Cabo Verde (3.1%, a difference of 0.10%), Bangladeshi (3.1%, a difference of 0.65%), Nepalese (3.1%, a difference of 0.88%), Aleut (3.0%, a difference of 1.5%), and Immigrants from Mexico (3.0%, a difference of 1.7%).
| Demographics | Rating | Rank | Single Father Households |
| Immigrants | Guatemala | 0.0 /100 | #322 | Tragic 3.0% |
| Immigrants | Central America | 0.0 /100 | #323 | Tragic 3.0% |
| Fijians | 0.0 /100 | #324 | Tragic 3.0% |
| Immigrants | Mexico | 0.0 /100 | #325 | Tragic 3.0% |
| Aleuts | 0.0 /100 | #326 | Tragic 3.0% |
| Bangladeshis | 0.0 /100 | #327 | Tragic 3.1% |
| Immigrants | Cabo Verde | 0.0 /100 | #328 | Tragic 3.1% |
| Chippewa | 0.0 /100 | #329 | Tragic 3.1% |
| Nepalese | 0.0 /100 | #330 | Tragic 3.1% |
| Navajo | 0.0 /100 | #331 | Tragic 3.2% |
| Yaqui | 0.0 /100 | #332 | Tragic 3.2% |
| Natives/Alaskans | 0.0 /100 | #333 | Tragic 3.2% |
| Yuman | 0.0 /100 | #334 | Tragic 3.3% |
| Colville | 0.0 /100 | #335 | Tragic 3.3% |
| Paiute | 0.0 /100 | #336 | Tragic 3.3% |
Demographics Similar to Osage by Single Father Households
In terms of single father households, the demographic groups most similar to Osage are Portuguese (2.5%, a difference of 0.030%), Immigrants from Dominica (2.5%, a difference of 0.29%), Spaniard (2.5%, a difference of 0.46%), Immigrants from Oceania (2.5%, a difference of 0.65%), and Immigrants from Middle Africa (2.5%, a difference of 0.65%).
| Demographics | Rating | Rank | Single Father Households |
| Immigrants | Immigrants | 6.3 /100 | #235 | Tragic 2.5% |
| Cajuns | 6.1 /100 | #236 | Tragic 2.5% |
| Sierra Leoneans | 5.9 /100 | #237 | Tragic 2.5% |
| Immigrants | Sierra Leone | 5.8 /100 | #238 | Tragic 2.5% |
| Immigrants | Oceania | 5.8 /100 | #239 | Tragic 2.5% |
| Immigrants | Dominica | 4.8 /100 | #240 | Tragic 2.5% |
| Portuguese | 4.1 /100 | #241 | Tragic 2.5% |
| Osage | 4.1 /100 | #242 | Tragic 2.5% |
| Spaniards | 3.1 /100 | #243 | Tragic 2.5% |
| Immigrants | Middle Africa | 2.8 /100 | #244 | Tragic 2.5% |
| Basques | 2.5 /100 | #245 | Tragic 2.5% |
| Native Hawaiians | 2.5 /100 | #246 | Tragic 2.5% |
| Delaware | 2.5 /100 | #247 | Tragic 2.5% |
| Bahamians | 2.4 /100 | #248 | Tragic 2.5% |
| Immigrants | Cameroon | 2.3 /100 | #249 | Tragic 2.5% |