Egyptian vs Immigrants from Mexico Child Poverty Among Girls Under 16
COMPARE
Egyptian
Immigrants from Mexico
Child Poverty Among Girls Under 16
Child Poverty Among Girls Under 16 Comparison
Egyptians
Immigrants from Mexico
14.7%
CHILD POVERTY AMONG GIRLS UNDER 16
97.9/ 100
METRIC RATING
80th/ 347
METRIC RANK
21.6%
CHILD POVERTY AMONG GIRLS UNDER 16
0.0/ 100
METRIC RATING
312th/ 347
METRIC RANK
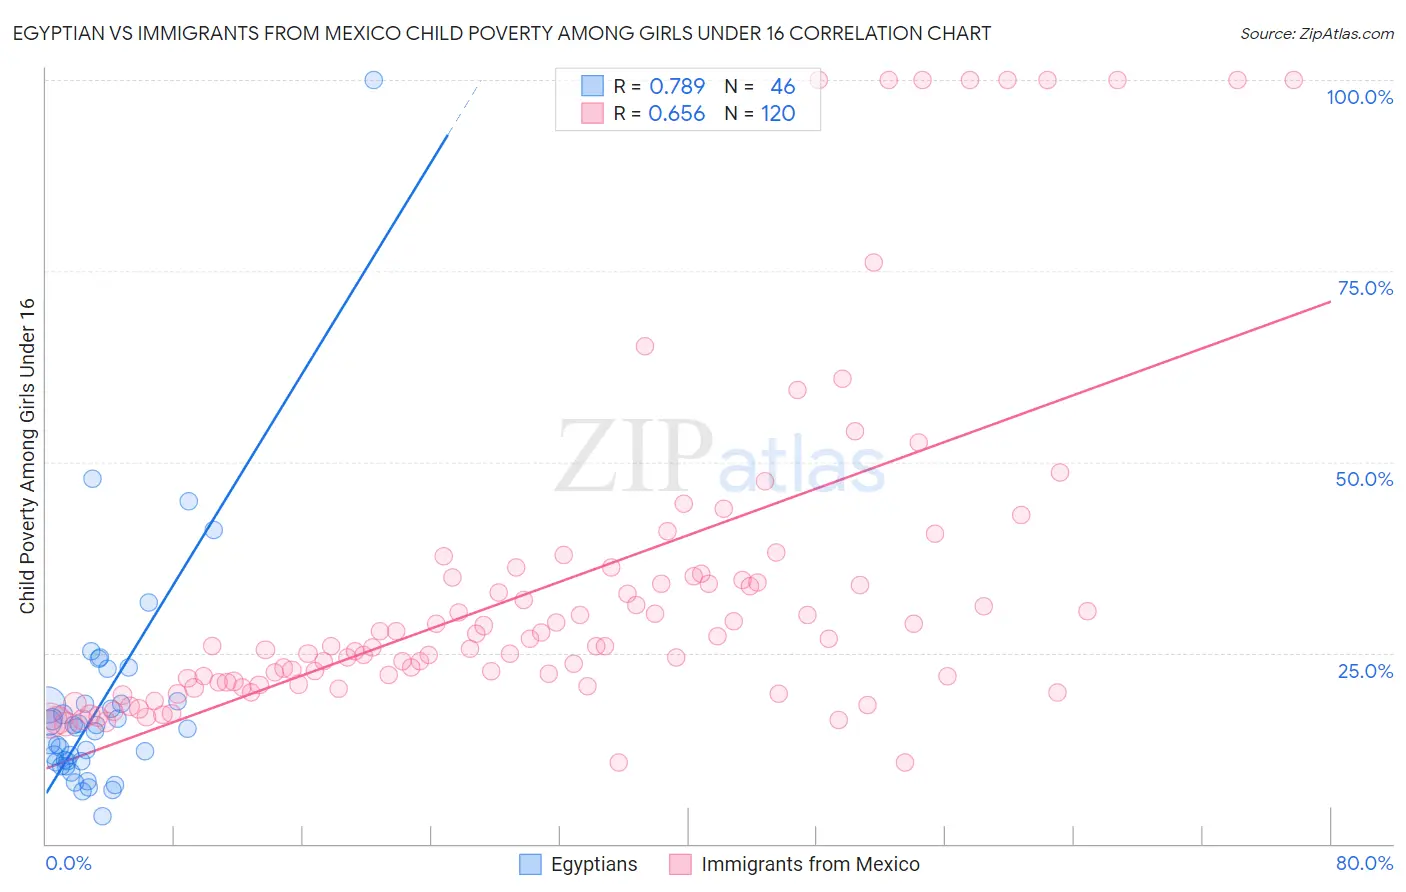
Egyptian vs Immigrants from Mexico Child Poverty Among Girls Under 16 Correlation Chart
The statistical analysis conducted on geographies consisting of 273,353,549 people shows a strong positive correlation between the proportion of Egyptians and poverty level among girls under the age of 16 in the United States with a correlation coefficient (R) of 0.789 and weighted average of 14.7%. Similarly, the statistical analysis conducted on geographies consisting of 501,744,550 people shows a significant positive correlation between the proportion of Immigrants from Mexico and poverty level among girls under the age of 16 in the United States with a correlation coefficient (R) of 0.656 and weighted average of 21.6%, a difference of 47.5%.
Child Poverty Among Girls Under 16 Correlation Summary
| Measurement | Egyptian | Immigrants from Mexico |
| Minimum | 3.6% | 10.6% |
| Maximum | 100.0% | 100.0% |
| Range | 96.4% | 89.4% |
| Mean | 18.3% | 33.4% |
| Median | 15.2% | 25.9% |
| Interquartile 25% (IQ1) | 10.8% | 21.0% |
| Interquartile 75% (IQ3) | 18.3% | 34.7% |
| Interquartile Range (IQR) | 7.6% | 13.8% |
| Standard Deviation (Sample) | 15.5% | 21.9% |
| Standard Deviation (Population) | 15.3% | 21.8% |
Similar Demographics by Child Poverty Among Girls Under 16
Demographics Similar to Egyptians by Child Poverty Among Girls Under 16
In terms of child poverty among girls under 16, the demographic groups most similar to Egyptians are Immigrants from Turkey (14.7%, a difference of 0.0%), Argentinean (14.7%, a difference of 0.020%), Tlingit-Haida (14.7%, a difference of 0.030%), Immigrants from Russia (14.7%, a difference of 0.040%), and Immigrants from Eastern Europe (14.6%, a difference of 0.18%).
| Demographics | Rating | Rank | Child Poverty Among Girls Under 16 |
| Immigrants | Austria | 98.0 /100 | #73 | Exceptional 14.6% |
| Taiwanese | 98.0 /100 | #74 | Exceptional 14.6% |
| Immigrants | Eastern Europe | 98.0 /100 | #75 | Exceptional 14.6% |
| Immigrants | Russia | 97.9 /100 | #76 | Exceptional 14.7% |
| Tlingit-Haida | 97.9 /100 | #77 | Exceptional 14.7% |
| Argentineans | 97.9 /100 | #78 | Exceptional 14.7% |
| Immigrants | Turkey | 97.9 /100 | #79 | Exceptional 14.7% |
| Egyptians | 97.9 /100 | #80 | Exceptional 14.7% |
| Ukrainians | 97.7 /100 | #81 | Exceptional 14.7% |
| Macedonians | 97.6 /100 | #82 | Exceptional 14.7% |
| Immigrants | Italy | 97.4 /100 | #83 | Exceptional 14.8% |
| Soviet Union | 97.3 /100 | #84 | Exceptional 14.8% |
| Swiss | 97.2 /100 | #85 | Exceptional 14.8% |
| Australians | 97.2 /100 | #86 | Exceptional 14.8% |
| Finns | 97.2 /100 | #87 | Exceptional 14.8% |
Demographics Similar to Immigrants from Mexico by Child Poverty Among Girls Under 16
In terms of child poverty among girls under 16, the demographic groups most similar to Immigrants from Mexico are Dutch West Indian (21.6%, a difference of 0.23%), Immigrants from Somalia (21.6%, a difference of 0.29%), Creek (21.7%, a difference of 0.50%), Arapaho (21.7%, a difference of 0.51%), and Bahamian (21.5%, a difference of 0.56%).
| Demographics | Rating | Rank | Child Poverty Among Girls Under 16 |
| Guatemalans | 0.0 /100 | #305 | Tragic 21.4% |
| Immigrants | Central America | 0.0 /100 | #306 | Tragic 21.4% |
| Immigrants | Bahamas | 0.0 /100 | #307 | Tragic 21.4% |
| Houma | 0.0 /100 | #308 | Tragic 21.5% |
| Bahamians | 0.0 /100 | #309 | Tragic 21.5% |
| Immigrants | Somalia | 0.0 /100 | #310 | Tragic 21.6% |
| Dutch West Indians | 0.0 /100 | #311 | Tragic 21.6% |
| Immigrants | Mexico | 0.0 /100 | #312 | Tragic 21.6% |
| Creek | 0.0 /100 | #313 | Tragic 21.7% |
| Arapaho | 0.0 /100 | #314 | Tragic 21.7% |
| Ute | 0.0 /100 | #315 | Tragic 21.8% |
| Immigrants | Guatemala | 0.0 /100 | #316 | Tragic 21.9% |
| Africans | 0.0 /100 | #317 | Tragic 21.9% |
| Immigrants | Dominica | 0.0 /100 | #318 | Tragic 22.1% |
| U.S. Virgin Islanders | 0.0 /100 | #319 | Tragic 22.1% |