Dutch West Indian vs Immigrants from North America Single Father Households
COMPARE
Dutch West Indian
Immigrants from North America
Single Father Households
Single Father Households Comparison
Dutch West Indians
Immigrants from North America
2.6%
SINGLE FATHER HOUSEHOLDS
0.1/ 100
METRIC RATING
282nd/ 347
METRIC RANK
2.2%
SINGLE FATHER HOUSEHOLDS
98.2/ 100
METRIC RATING
114th/ 347
METRIC RANK
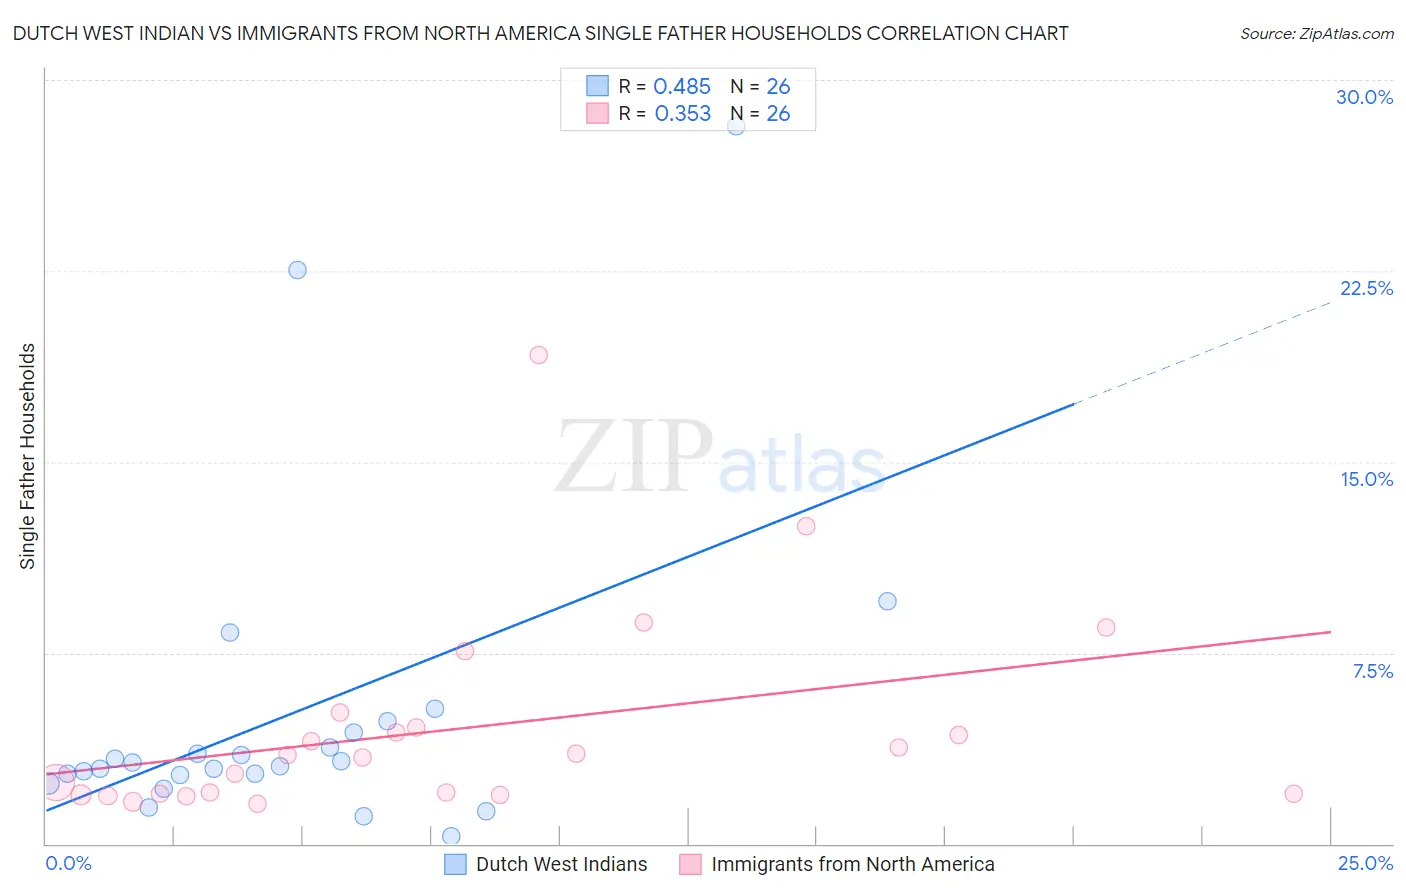
Dutch West Indian vs Immigrants from North America Single Father Households Correlation Chart
The statistical analysis conducted on geographies consisting of 85,485,397 people shows a moderate positive correlation between the proportion of Dutch West Indians and percentage of single father households in the United States with a correlation coefficient (R) of 0.485 and weighted average of 2.6%. Similarly, the statistical analysis conducted on geographies consisting of 456,447,919 people shows a mild positive correlation between the proportion of Immigrants from North America and percentage of single father households in the United States with a correlation coefficient (R) of 0.353 and weighted average of 2.2%, a difference of 21.8%.
Single Father Households Correlation Summary
| Measurement | Dutch West Indian | Immigrants from North America |
| Minimum | 0.30% | 1.6% |
| Maximum | 28.2% | 19.2% |
| Range | 27.9% | 17.6% |
| Mean | 5.1% | 4.5% |
| Median | 3.1% | 3.4% |
| Interquartile 25% (IQ1) | 2.7% | 1.9% |
| Interquartile 75% (IQ3) | 4.4% | 4.6% |
| Interquartile Range (IQR) | 1.6% | 2.6% |
| Standard Deviation (Sample) | 6.3% | 4.0% |
| Standard Deviation (Population) | 6.2% | 3.9% |
Similar Demographics by Single Father Households
Demographics Similar to Dutch West Indians by Single Father Households
In terms of single father households, the demographic groups most similar to Dutch West Indians are Nicaraguan (2.6%, a difference of 0.050%), Immigrants from Portugal (2.6%, a difference of 0.060%), Samoan (2.6%, a difference of 0.61%), Cherokee (2.6%, a difference of 0.65%), and Immigrants from Nicaragua (2.7%, a difference of 0.69%).
| Demographics | Rating | Rank | Single Father Households |
| Immigrants | Dominican Republic | 0.2 /100 | #275 | Tragic 2.6% |
| Immigrants | Haiti | 0.1 /100 | #276 | Tragic 2.6% |
| Shoshone | 0.1 /100 | #277 | Tragic 2.6% |
| Cherokee | 0.1 /100 | #278 | Tragic 2.6% |
| Samoans | 0.1 /100 | #279 | Tragic 2.6% |
| Immigrants | Portugal | 0.1 /100 | #280 | Tragic 2.6% |
| Nicaraguans | 0.1 /100 | #281 | Tragic 2.6% |
| Dutch West Indians | 0.1 /100 | #282 | Tragic 2.6% |
| Immigrants | Nicaragua | 0.1 /100 | #283 | Tragic 2.7% |
| Hawaiians | 0.1 /100 | #284 | Tragic 2.7% |
| Ottawa | 0.1 /100 | #285 | Tragic 2.7% |
| Immigrants | Cuba | 0.1 /100 | #286 | Tragic 2.7% |
| Central American Indians | 0.0 /100 | #287 | Tragic 2.7% |
| Immigrants | Cambodia | 0.0 /100 | #288 | Tragic 2.7% |
| Tlingit-Haida | 0.0 /100 | #289 | Tragic 2.7% |
Demographics Similar to Immigrants from North America by Single Father Households
In terms of single father households, the demographic groups most similar to Immigrants from North America are Immigrants from Barbados (2.2%, a difference of 0.030%), Iraqi (2.2%, a difference of 0.040%), Immigrants from Trinidad and Tobago (2.2%, a difference of 0.060%), Immigrants from Argentina (2.2%, a difference of 0.060%), and Immigrants from Canada (2.2%, a difference of 0.090%).
| Demographics | Rating | Rank | Single Father Households |
| Slovenes | 98.5 /100 | #107 | Exceptional 2.2% |
| Immigrants | Netherlands | 98.5 /100 | #108 | Exceptional 2.2% |
| Barbadians | 98.4 /100 | #109 | Exceptional 2.2% |
| Italians | 98.3 /100 | #110 | Exceptional 2.2% |
| Immigrants | Canada | 98.3 /100 | #111 | Exceptional 2.2% |
| Immigrants | Trinidad and Tobago | 98.2 /100 | #112 | Exceptional 2.2% |
| Iraqis | 98.2 /100 | #113 | Exceptional 2.2% |
| Immigrants | North America | 98.2 /100 | #114 | Exceptional 2.2% |
| Immigrants | Barbados | 98.2 /100 | #115 | Exceptional 2.2% |
| Immigrants | Argentina | 98.1 /100 | #116 | Exceptional 2.2% |
| Hungarians | 97.9 /100 | #117 | Exceptional 2.2% |
| Immigrants | Morocco | 97.8 /100 | #118 | Exceptional 2.2% |
| Trinidadians and Tobagonians | 97.8 /100 | #119 | Exceptional 2.2% |
| Australians | 97.7 /100 | #120 | Exceptional 2.2% |
| Immigrants | Brazil | 97.7 /100 | #121 | Exceptional 2.2% |