Dutch vs Immigrants from Laos Average Family Size
COMPARE
Dutch
Immigrants from Laos
Average Family Size
Average Family Size Comparison
Dutch
Immigrants from Laos
3.11
AVERAGE FAMILY SIZE
0.0/ 100
METRIC RATING
327th/ 347
METRIC RANK
3.34
AVERAGE FAMILY SIZE
99.9/ 100
METRIC RATING
65th/ 347
METRIC RANK
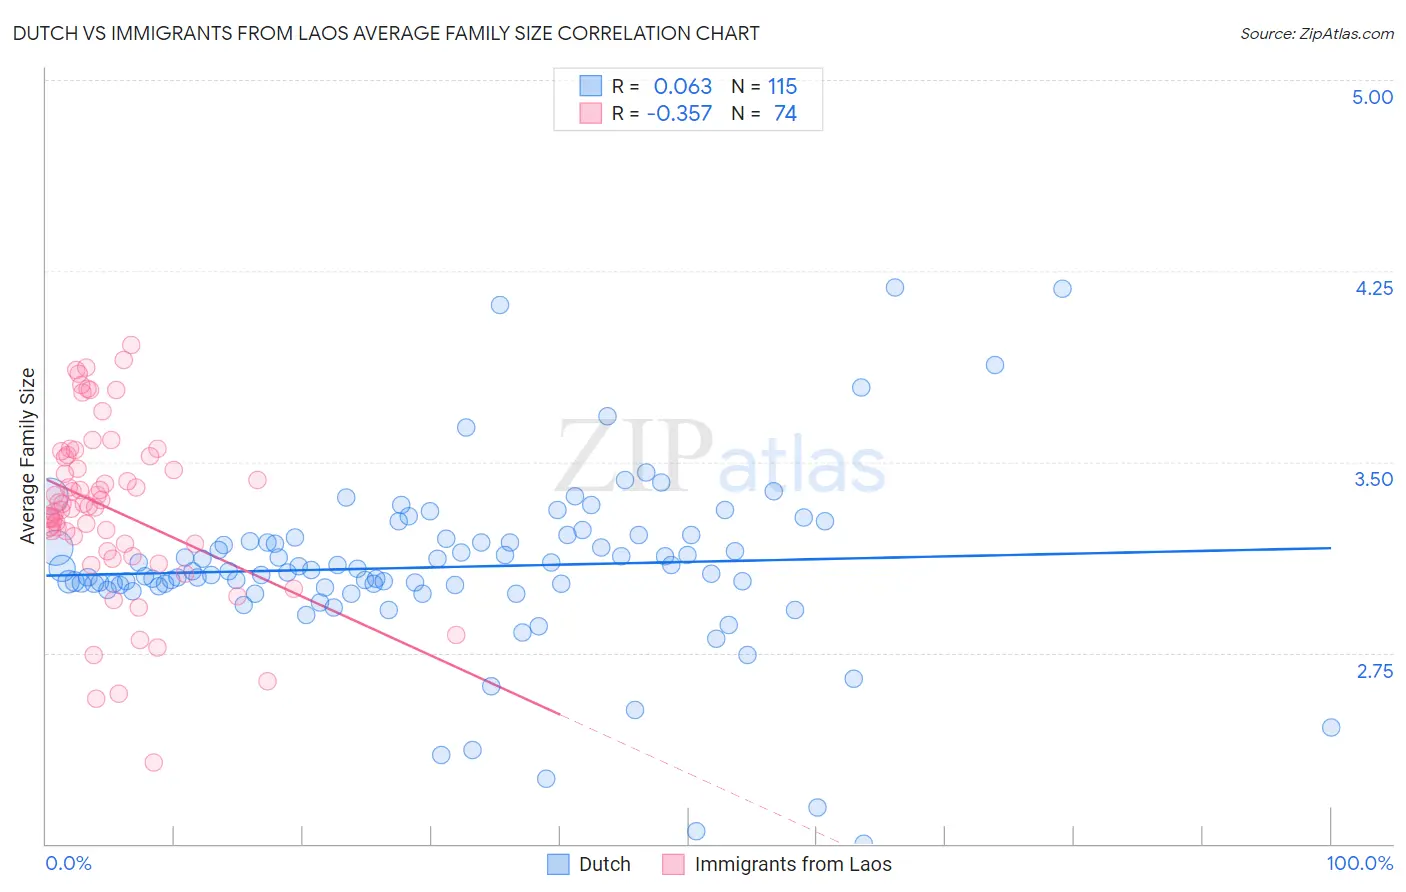
Dutch vs Immigrants from Laos Average Family Size Correlation Chart
The statistical analysis conducted on geographies consisting of 553,876,215 people shows a slight positive correlation between the proportion of Dutch and average family size in the United States with a correlation coefficient (R) of 0.063 and weighted average of 3.11. Similarly, the statistical analysis conducted on geographies consisting of 201,468,648 people shows a mild negative correlation between the proportion of Immigrants from Laos and average family size in the United States with a correlation coefficient (R) of -0.357 and weighted average of 3.34, a difference of 7.3%.
Average Family Size Correlation Summary
| Measurement | Dutch | Immigrants from Laos |
| Minimum | 2.00 | 2.32 |
| Maximum | 4.19 | 3.96 |
| Range | 2.19 | 1.64 |
| Mean | 3.09 | 3.32 |
| Median | 3.07 | 3.33 |
| Interquartile 25% (IQ1) | 3.01 | 3.18 |
| Interquartile 75% (IQ3) | 3.20 | 3.52 |
| Interquartile Range (IQR) | 0.19 | 0.34 |
| Standard Deviation (Sample) | 0.34 | 0.33 |
| Standard Deviation (Population) | 0.34 | 0.33 |
Similar Demographics by Average Family Size
Demographics Similar to Dutch by Average Family Size
In terms of average family size, the demographic groups most similar to Dutch are Czech (3.11, a difference of 0.0%), Ottawa (3.11, a difference of 0.010%), English (3.11, a difference of 0.060%), Belgian (3.11, a difference of 0.060%), and Celtic (3.11, a difference of 0.10%).
| Demographics | Rating | Rank | Average Family Size |
| Immigrants | North America | 0.0 /100 | #320 | Tragic 3.12 |
| Immigrants | Austria | 0.0 /100 | #321 | Tragic 3.12 |
| Immigrants | Canada | 0.0 /100 | #322 | Tragic 3.12 |
| Soviet Union | 0.0 /100 | #323 | Tragic 3.11 |
| Celtics | 0.0 /100 | #324 | Tragic 3.11 |
| English | 0.0 /100 | #325 | Tragic 3.11 |
| Ottawa | 0.0 /100 | #326 | Tragic 3.11 |
| Dutch | 0.0 /100 | #327 | Tragic 3.11 |
| Czechs | 0.0 /100 | #328 | Tragic 3.11 |
| Belgians | 0.0 /100 | #329 | Tragic 3.11 |
| Latvians | 0.0 /100 | #330 | Tragic 3.11 |
| Scotch-Irish | 0.0 /100 | #331 | Tragic 3.11 |
| Scottish | 0.0 /100 | #332 | Tragic 3.11 |
| Estonians | 0.0 /100 | #333 | Tragic 3.10 |
| Lithuanians | 0.0 /100 | #334 | Tragic 3.10 |
Demographics Similar to Immigrants from Laos by Average Family Size
In terms of average family size, the demographic groups most similar to Immigrants from Laos are Dominican (3.34, a difference of 0.020%), Immigrants from St. Vincent and the Grenadines (3.34, a difference of 0.060%), Chinese (3.34, a difference of 0.090%), Immigrants from Jamaica (3.33, a difference of 0.10%), and Immigrants from Grenada (3.34, a difference of 0.11%).
| Demographics | Rating | Rank | Average Family Size |
| Hondurans | 100.0 /100 | #58 | Exceptional 3.35 |
| Japanese | 100.0 /100 | #59 | Exceptional 3.35 |
| Immigrants | Armenia | 100.0 /100 | #60 | Exceptional 3.35 |
| Central American Indians | 100.0 /100 | #61 | Exceptional 3.35 |
| Immigrants | Grenada | 100.0 /100 | #62 | Exceptional 3.34 |
| Chinese | 100.0 /100 | #63 | Exceptional 3.34 |
| Dominicans | 99.9 /100 | #64 | Exceptional 3.34 |
| Immigrants | Laos | 99.9 /100 | #65 | Exceptional 3.34 |
| Immigrants | St. Vincent and the Grenadines | 99.9 /100 | #66 | Exceptional 3.34 |
| Immigrants | Jamaica | 99.9 /100 | #67 | Exceptional 3.33 |
| Immigrants | Cambodia | 99.9 /100 | #68 | Exceptional 3.33 |
| Immigrants | Immigrants | 99.9 /100 | #69 | Exceptional 3.33 |
| Immigrants | Trinidad and Tobago | 99.9 /100 | #70 | Exceptional 3.33 |
| Immigrants | West Indies | 99.9 /100 | #71 | Exceptional 3.33 |
| Immigrants | Caribbean | 99.9 /100 | #72 | Exceptional 3.33 |