Dutch vs Immigrants from Latvia Average Family Size
COMPARE
Dutch
Immigrants from Latvia
Average Family Size
Average Family Size Comparison
Dutch
Immigrants from Latvia
3.11
AVERAGE FAMILY SIZE
0.0/ 100
METRIC RATING
327th/ 347
METRIC RANK
3.13
AVERAGE FAMILY SIZE
0.2/ 100
METRIC RATING
302nd/ 347
METRIC RANK
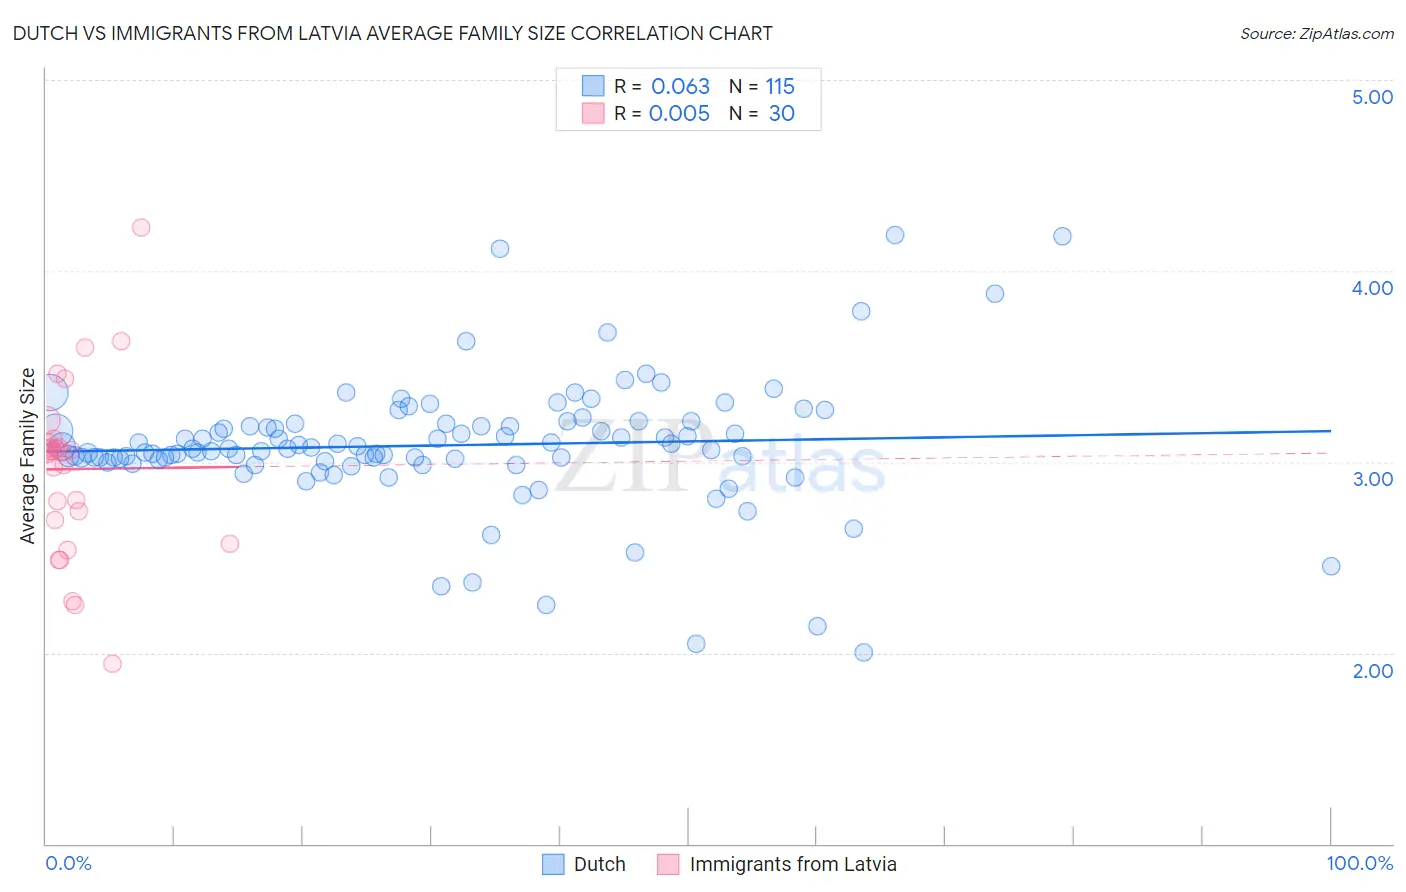
Dutch vs Immigrants from Latvia Average Family Size Correlation Chart
The statistical analysis conducted on geographies consisting of 553,876,215 people shows a slight positive correlation between the proportion of Dutch and average family size in the United States with a correlation coefficient (R) of 0.063 and weighted average of 3.11. Similarly, the statistical analysis conducted on geographies consisting of 113,732,502 people shows no correlation between the proportion of Immigrants from Latvia and average family size in the United States with a correlation coefficient (R) of 0.005 and weighted average of 3.13, a difference of 0.81%.
Average Family Size Correlation Summary
| Measurement | Dutch | Immigrants from Latvia |
| Minimum | 2.00 | 1.94 |
| Maximum | 4.19 | 4.23 |
| Range | 2.19 | 2.29 |
| Mean | 3.09 | 2.96 |
| Median | 3.07 | 3.05 |
| Interquartile 25% (IQ1) | 3.01 | 2.70 |
| Interquartile 75% (IQ3) | 3.20 | 3.10 |
| Interquartile Range (IQR) | 0.19 | 0.40 |
| Standard Deviation (Sample) | 0.34 | 0.46 |
| Standard Deviation (Population) | 0.34 | 0.45 |
Similar Demographics by Average Family Size
Demographics Similar to Dutch by Average Family Size
In terms of average family size, the demographic groups most similar to Dutch are Czech (3.11, a difference of 0.0%), Ottawa (3.11, a difference of 0.010%), English (3.11, a difference of 0.060%), Belgian (3.11, a difference of 0.060%), and Celtic (3.11, a difference of 0.10%).
| Demographics | Rating | Rank | Average Family Size |
| Immigrants | North America | 0.0 /100 | #320 | Tragic 3.12 |
| Immigrants | Austria | 0.0 /100 | #321 | Tragic 3.12 |
| Immigrants | Canada | 0.0 /100 | #322 | Tragic 3.12 |
| Soviet Union | 0.0 /100 | #323 | Tragic 3.11 |
| Celtics | 0.0 /100 | #324 | Tragic 3.11 |
| English | 0.0 /100 | #325 | Tragic 3.11 |
| Ottawa | 0.0 /100 | #326 | Tragic 3.11 |
| Dutch | 0.0 /100 | #327 | Tragic 3.11 |
| Czechs | 0.0 /100 | #328 | Tragic 3.11 |
| Belgians | 0.0 /100 | #329 | Tragic 3.11 |
| Latvians | 0.0 /100 | #330 | Tragic 3.11 |
| Scotch-Irish | 0.0 /100 | #331 | Tragic 3.11 |
| Scottish | 0.0 /100 | #332 | Tragic 3.11 |
| Estonians | 0.0 /100 | #333 | Tragic 3.10 |
| Lithuanians | 0.0 /100 | #334 | Tragic 3.10 |
Demographics Similar to Immigrants from Latvia by Average Family Size
In terms of average family size, the demographic groups most similar to Immigrants from Latvia are Macedonian (3.13, a difference of 0.0%), British (3.13, a difference of 0.010%), Immigrants from Switzerland (3.13, a difference of 0.030%), Australian (3.13, a difference of 0.050%), and Immigrants from Sweden (3.14, a difference of 0.070%).
| Demographics | Rating | Rank | Average Family Size |
| Austrians | 0.2 /100 | #295 | Tragic 3.14 |
| Ukrainians | 0.2 /100 | #296 | Tragic 3.14 |
| Immigrants | Western Europe | 0.2 /100 | #297 | Tragic 3.14 |
| Colville | 0.2 /100 | #298 | Tragic 3.14 |
| Canadians | 0.2 /100 | #299 | Tragic 3.14 |
| Immigrants | Sweden | 0.2 /100 | #300 | Tragic 3.14 |
| Macedonians | 0.2 /100 | #301 | Tragic 3.13 |
| Immigrants | Latvia | 0.2 /100 | #302 | Tragic 3.13 |
| British | 0.2 /100 | #303 | Tragic 3.13 |
| Immigrants | Switzerland | 0.2 /100 | #304 | Tragic 3.13 |
| Australians | 0.1 /100 | #305 | Tragic 3.13 |
| Immigrants | Ireland | 0.1 /100 | #306 | Tragic 3.13 |
| Immigrants | Serbia | 0.1 /100 | #307 | Tragic 3.13 |
| Slavs | 0.1 /100 | #308 | Tragic 3.13 |
| Northern Europeans | 0.1 /100 | #309 | Tragic 3.13 |