Immigrants from China vs Spanish American Family Households with Children
COMPARE
Immigrants from China
Spanish American
Family Households with Children
Family Households with Children Comparison
Immigrants from China
Spanish Americans
27.4%
FAMILY HOUSEHOLDS WITH CHILDREN
49.6/ 100
METRIC RATING
176th/ 347
METRIC RANK
27.4%
FAMILY HOUSEHOLDS WITH CHILDREN
48.9/ 100
METRIC RATING
178th/ 347
METRIC RANK
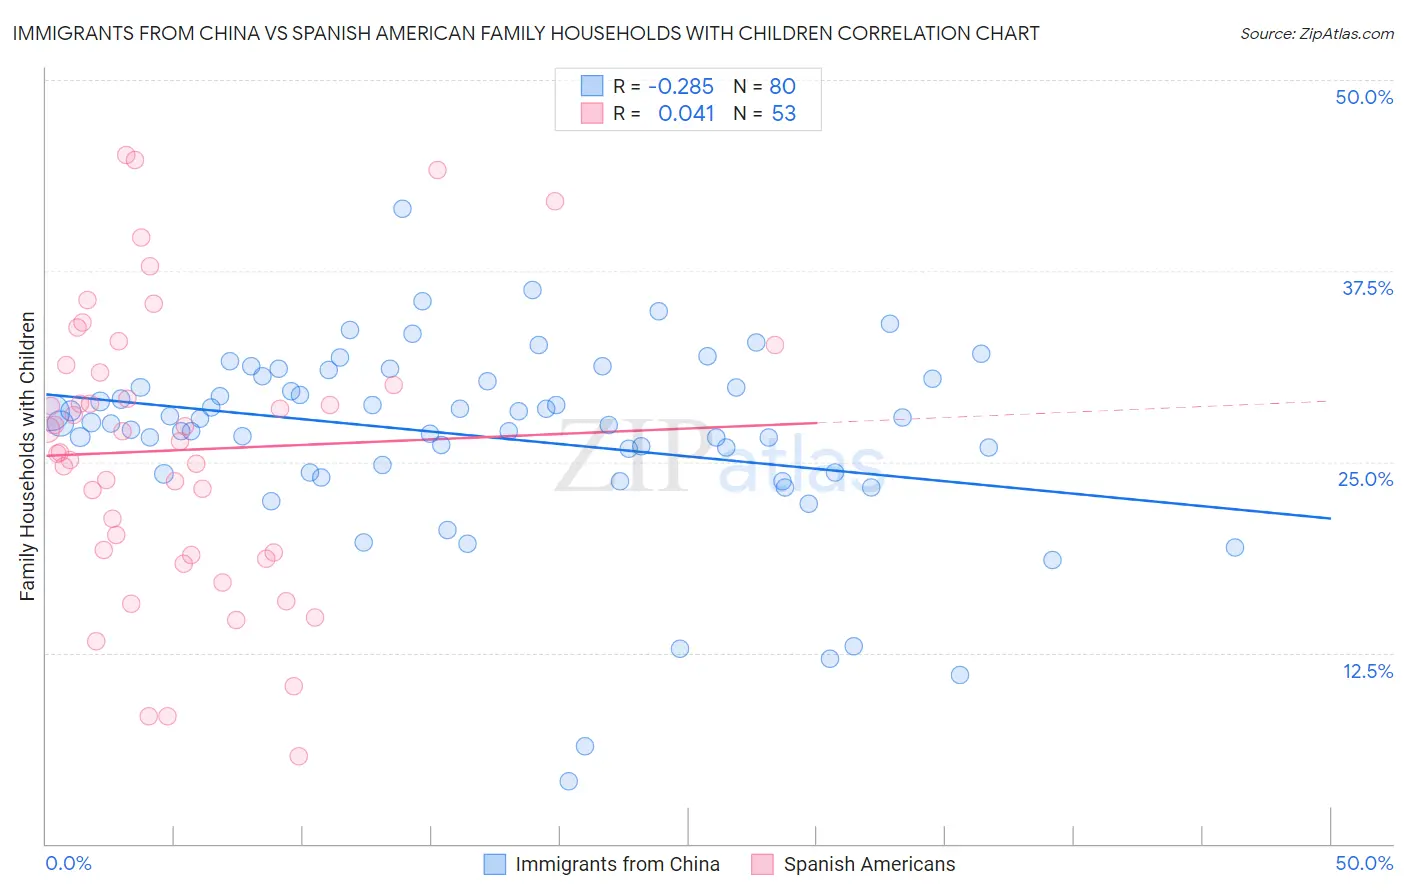
Immigrants from China vs Spanish American Family Households with Children Correlation Chart
The statistical analysis conducted on geographies consisting of 456,380,554 people shows a weak negative correlation between the proportion of Immigrants from China and percentage of family households with children in the United States with a correlation coefficient (R) of -0.285 and weighted average of 27.4%. Similarly, the statistical analysis conducted on geographies consisting of 103,165,660 people shows no correlation between the proportion of Spanish Americans and percentage of family households with children in the United States with a correlation coefficient (R) of 0.041 and weighted average of 27.4%, a difference of 0.020%.
Family Households with Children Correlation Summary
| Measurement | Immigrants from China | Spanish American |
| Minimum | 4.1% | 5.7% |
| Maximum | 41.6% | 45.1% |
| Range | 37.5% | 39.4% |
| Mean | 26.7% | 25.8% |
| Median | 27.6% | 26.3% |
| Interquartile 25% (IQ1) | 24.3% | 19.0% |
| Interquartile 75% (IQ3) | 30.4% | 31.1% |
| Interquartile Range (IQR) | 6.1% | 12.1% |
| Standard Deviation (Sample) | 6.3% | 9.3% |
| Standard Deviation (Population) | 6.3% | 9.2% |
Demographics Similar to Immigrants from China and Spanish Americans by Family Households with Children
In terms of family households with children, the demographic groups most similar to Immigrants from China are White/Caucasian (27.4%, a difference of 0.010%), British (27.4%, a difference of 0.010%), Ugandan (27.4%, a difference of 0.010%), Immigrants from Argentina (27.5%, a difference of 0.060%), and Turkish (27.4%, a difference of 0.060%). Similarly, the demographic groups most similar to Spanish Americans are Ugandan (27.4%, a difference of 0.010%), White/Caucasian (27.4%, a difference of 0.020%), British (27.4%, a difference of 0.020%), Turkish (27.4%, a difference of 0.040%), and Immigrants from Turkey (27.4%, a difference of 0.040%).
| Demographics | Rating | Rank | Family Households with Children |
| Dominicans | 61.1 /100 | #167 | Good 27.5% |
| Immigrants | Kuwait | 60.9 /100 | #168 | Good 27.5% |
| Seminole | 56.9 /100 | #169 | Average 27.5% |
| Cherokee | 56.7 /100 | #170 | Average 27.5% |
| Blackfeet | 54.3 /100 | #171 | Average 27.5% |
| Israelis | 53.9 /100 | #172 | Average 27.5% |
| Immigrants | Argentina | 52.2 /100 | #173 | Average 27.5% |
| Whites/Caucasians | 50.0 /100 | #174 | Average 27.4% |
| British | 49.9 /100 | #175 | Average 27.4% |
| Immigrants | China | 49.6 /100 | #176 | Average 27.4% |
| Ugandans | 49.2 /100 | #177 | Average 27.4% |
| Spanish Americans | 48.9 /100 | #178 | Average 27.4% |
| Turks | 46.9 /100 | #179 | Average 27.4% |
| Immigrants | Turkey | 46.9 /100 | #180 | Average 27.4% |
| Aleuts | 46.7 /100 | #181 | Average 27.4% |
| Puget Sound Salish | 46.2 /100 | #182 | Average 27.4% |
| South Africans | 44.9 /100 | #183 | Average 27.4% |
| Native Hawaiians | 44.6 /100 | #184 | Average 27.4% |
| Delaware | 42.0 /100 | #185 | Average 27.4% |
| Immigrants | Brazil | 40.6 /100 | #186 | Average 27.4% |
| Creek | 39.8 /100 | #187 | Fair 27.4% |