Czech vs Brazilian Family Households with Children
COMPARE
Czech
Brazilian
Family Households with Children
Family Households with Children Comparison
Czechs
Brazilians
27.5%
FAMILY HOUSEHOLDS WITH CHILDREN
65.3/ 100
METRIC RATING
163rd/ 347
METRIC RANK
27.7%
FAMILY HOUSEHOLDS WITH CHILDREN
79.6/ 100
METRIC RATING
144th/ 347
METRIC RANK
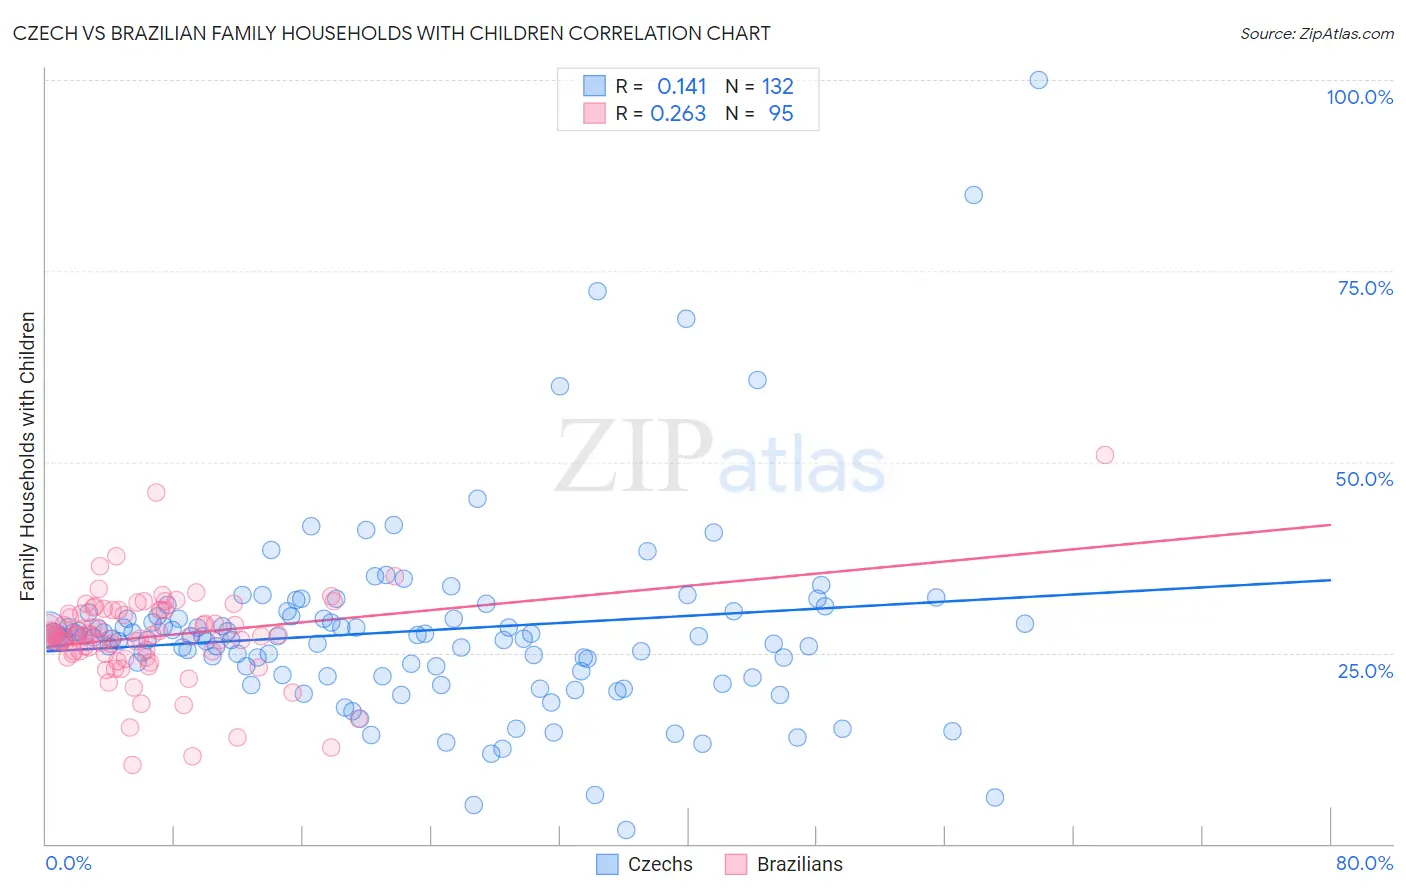
Czech vs Brazilian Family Households with Children Correlation Chart
The statistical analysis conducted on geographies consisting of 484,223,997 people shows a poor positive correlation between the proportion of Czechs and percentage of family households with children in the United States with a correlation coefficient (R) of 0.141 and weighted average of 27.5%. Similarly, the statistical analysis conducted on geographies consisting of 323,614,103 people shows a weak positive correlation between the proportion of Brazilians and percentage of family households with children in the United States with a correlation coefficient (R) of 0.263 and weighted average of 27.7%, a difference of 0.40%.
Family Households with Children Correlation Summary
| Measurement | Czech | Brazilian |
| Minimum | 1.9% | 10.3% |
| Maximum | 100.0% | 50.9% |
| Range | 98.1% | 40.6% |
| Mean | 27.9% | 27.1% |
| Median | 27.1% | 27.3% |
| Interquartile 25% (IQ1) | 22.3% | 24.9% |
| Interquartile 75% (IQ3) | 29.8% | 30.6% |
| Interquartile Range (IQR) | 7.4% | 5.7% |
| Standard Deviation (Sample) | 12.9% | 5.9% |
| Standard Deviation (Population) | 12.8% | 5.9% |
Demographics Similar to Czechs and Brazilians by Family Households with Children
In terms of family households with children, the demographic groups most similar to Czechs are Alaskan Athabascan (27.6%, a difference of 0.040%), Immigrants from Bangladesh (27.6%, a difference of 0.040%), Subsaharan African (27.6%, a difference of 0.050%), Romanian (27.6%, a difference of 0.14%), and Mongolian (27.6%, a difference of 0.14%). Similarly, the demographic groups most similar to Brazilians are Immigrants from Chile (27.7%, a difference of 0.010%), Basque (27.7%, a difference of 0.010%), Immigrants from Eastern Africa (27.7%, a difference of 0.020%), Immigrants from Moldova (27.6%, a difference of 0.020%), and Osage (27.6%, a difference of 0.020%).
| Demographics | Rating | Rank | Family Households with Children |
| Immigrants | Eastern Africa | 80.2 /100 | #143 | Excellent 27.7% |
| Brazilians | 79.6 /100 | #144 | Good 27.7% |
| Immigrants | Chile | 79.5 /100 | #145 | Good 27.7% |
| Basques | 79.5 /100 | #146 | Good 27.7% |
| Immigrants | Moldova | 79.1 /100 | #147 | Good 27.6% |
| Osage | 79.0 /100 | #148 | Good 27.6% |
| Menominee | 78.9 /100 | #149 | Good 27.6% |
| Argentineans | 78.5 /100 | #150 | Good 27.6% |
| Portuguese | 77.8 /100 | #151 | Good 27.6% |
| Ethiopians | 77.0 /100 | #152 | Good 27.6% |
| Immigrants | Cabo Verde | 75.6 /100 | #153 | Good 27.6% |
| Icelanders | 75.3 /100 | #154 | Good 27.6% |
| Comanche | 74.8 /100 | #155 | Good 27.6% |
| Hungarians | 74.6 /100 | #156 | Good 27.6% |
| Indians (Asian) | 71.6 /100 | #157 | Good 27.6% |
| Romanians | 70.8 /100 | #158 | Good 27.6% |
| Mongolians | 70.7 /100 | #159 | Good 27.6% |
| Sub-Saharan Africans | 67.5 /100 | #160 | Good 27.6% |
| Alaskan Athabascans | 67.1 /100 | #161 | Good 27.6% |
| Immigrants | Bangladesh | 67.0 /100 | #162 | Good 27.6% |
| Czechs | 65.3 /100 | #163 | Good 27.5% |