Czechoslovakian vs Panamanian Unemployment Among Youth under 25 years
COMPARE
Czechoslovakian
Panamanian
Unemployment Among Youth under 25 years
Unemployment Among Youth under 25 years Comparison
Czechoslovakians
Panamanians
11.0%
UNEMPLOYMENT AMONG YOUTH UNDER 25 YEARS
99.2/ 100
METRIC RATING
50th/ 347
METRIC RANK
12.4%
UNEMPLOYMENT AMONG YOUTH UNDER 25 YEARS
0.2/ 100
METRIC RATING
257th/ 347
METRIC RANK
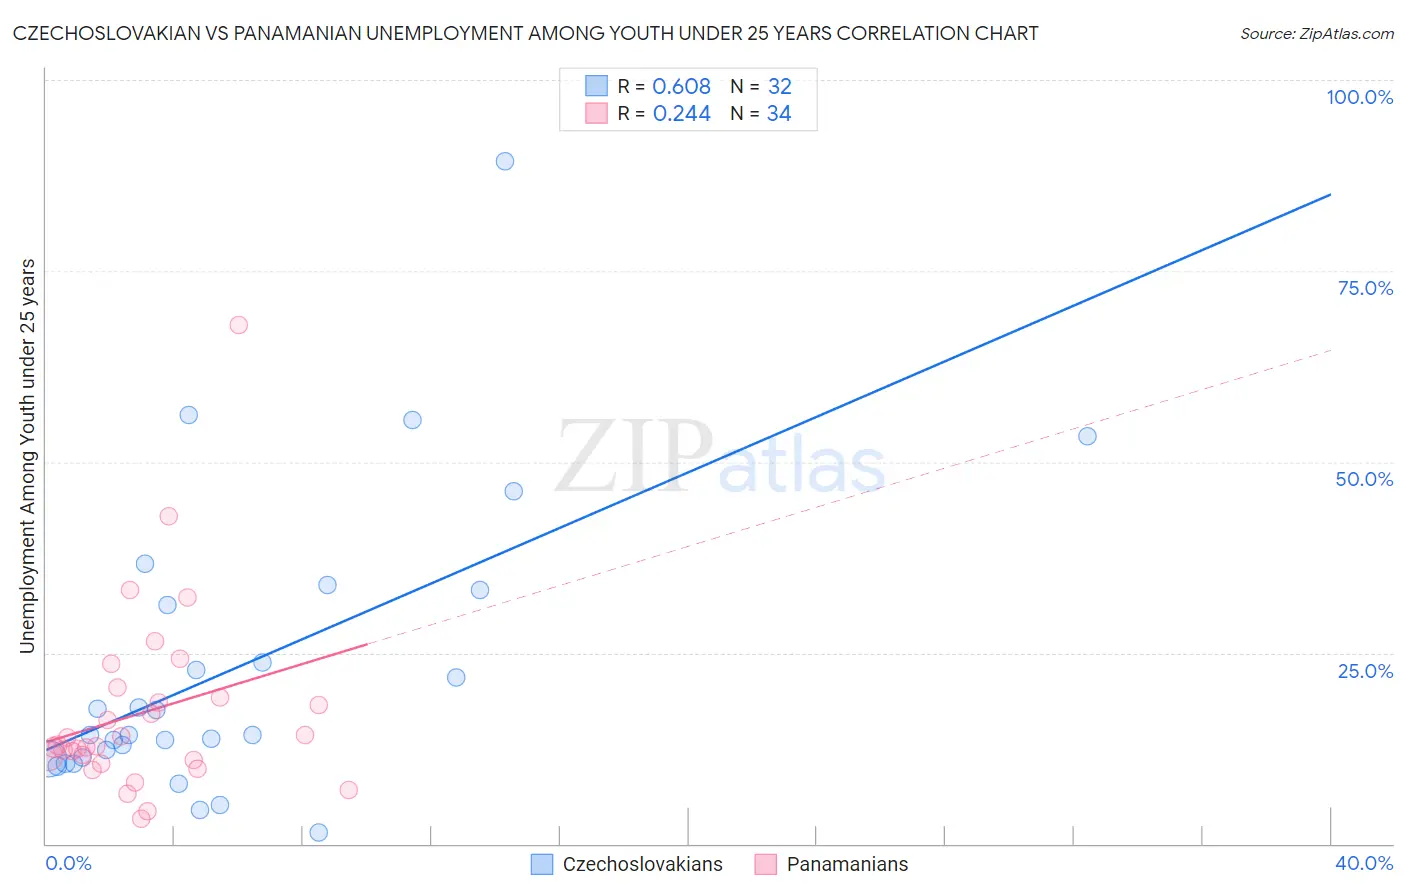
Czechoslovakian vs Panamanian Unemployment Among Youth under 25 years Correlation Chart
The statistical analysis conducted on geographies consisting of 362,760,645 people shows a significant positive correlation between the proportion of Czechoslovakians and unemployment rate among youth under the age of 25 in the United States with a correlation coefficient (R) of 0.608 and weighted average of 11.0%. Similarly, the statistical analysis conducted on geographies consisting of 279,636,521 people shows a weak positive correlation between the proportion of Panamanians and unemployment rate among youth under the age of 25 in the United States with a correlation coefficient (R) of 0.244 and weighted average of 12.4%, a difference of 12.3%.
Unemployment Among Youth under 25 years Correlation Summary
| Measurement | Czechoslovakian | Panamanian |
| Minimum | 1.4% | 3.3% |
| Maximum | 89.4% | 67.9% |
| Range | 88.0% | 64.6% |
| Mean | 23.1% | 17.2% |
| Median | 14.3% | 12.9% |
| Interquartile 25% (IQ1) | 11.2% | 11.0% |
| Interquartile 75% (IQ3) | 32.3% | 19.1% |
| Interquartile Range (IQR) | 21.0% | 8.1% |
| Standard Deviation (Sample) | 19.2% | 12.3% |
| Standard Deviation (Population) | 18.9% | 12.1% |
Similar Demographics by Unemployment Among Youth under 25 years
Demographics Similar to Czechoslovakians by Unemployment Among Youth under 25 years
In terms of unemployment among youth under 25 years, the demographic groups most similar to Czechoslovakians are Thai (11.0%, a difference of 0.090%), Polish (11.0%, a difference of 0.17%), Serbian (11.0%, a difference of 0.23%), Latvian (11.0%, a difference of 0.25%), and Ottawa (11.1%, a difference of 0.34%).
| Demographics | Rating | Rank | Unemployment Among Youth under 25 years |
| British | 99.7 /100 | #43 | Exceptional 10.9% |
| Welsh | 99.7 /100 | #44 | Exceptional 10.9% |
| Bulgarians | 99.6 /100 | #45 | Exceptional 10.9% |
| Tongans | 99.6 /100 | #46 | Exceptional 10.9% |
| Australians | 99.6 /100 | #47 | Exceptional 10.9% |
| Poles | 99.3 /100 | #48 | Exceptional 11.0% |
| Thais | 99.3 /100 | #49 | Exceptional 11.0% |
| Czechoslovakians | 99.2 /100 | #50 | Exceptional 11.0% |
| Serbians | 99.0 /100 | #51 | Exceptional 11.0% |
| Latvians | 99.0 /100 | #52 | Exceptional 11.0% |
| Ottawa | 99.0 /100 | #53 | Exceptional 11.1% |
| Mongolians | 98.9 /100 | #54 | Exceptional 11.1% |
| Irish | 98.9 /100 | #55 | Exceptional 11.1% |
| Immigrants | Saudi Arabia | 98.8 /100 | #56 | Exceptional 11.1% |
| Immigrants | Eritrea | 98.8 /100 | #57 | Exceptional 11.1% |
Demographics Similar to Panamanians by Unemployment Among Youth under 25 years
In terms of unemployment among youth under 25 years, the demographic groups most similar to Panamanians are Liberian (12.4%, a difference of 0.010%), Salvadoran (12.4%, a difference of 0.030%), Hispanic or Latino (12.4%, a difference of 0.080%), Immigrants from Central America (12.4%, a difference of 0.080%), and Immigrants from Panama (12.4%, a difference of 0.38%).
| Demographics | Rating | Rank | Unemployment Among Youth under 25 years |
| Delaware | 0.4 /100 | #250 | Tragic 12.3% |
| Mexican American Indians | 0.4 /100 | #251 | Tragic 12.3% |
| Immigrants | Syria | 0.3 /100 | #252 | Tragic 12.3% |
| Mexicans | 0.3 /100 | #253 | Tragic 12.3% |
| Hondurans | 0.3 /100 | #254 | Tragic 12.3% |
| Hispanics or Latinos | 0.2 /100 | #255 | Tragic 12.4% |
| Liberians | 0.2 /100 | #256 | Tragic 12.4% |
| Panamanians | 0.2 /100 | #257 | Tragic 12.4% |
| Salvadorans | 0.1 /100 | #258 | Tragic 12.4% |
| Immigrants | Central America | 0.1 /100 | #259 | Tragic 12.4% |
| Immigrants | Panama | 0.1 /100 | #260 | Tragic 12.4% |
| Immigrants | El Salvador | 0.1 /100 | #261 | Tragic 12.4% |
| Immigrants | Mexico | 0.1 /100 | #262 | Tragic 12.4% |
| Cree | 0.1 /100 | #263 | Tragic 12.4% |
| Puget Sound Salish | 0.1 /100 | #264 | Tragic 12.5% |