Immigrants from Cabo Verde vs Immigrants from Lebanon Family Households with Children
COMPARE
Immigrants from Cabo Verde
Immigrants from Lebanon
Family Households with Children
Family Households with Children Comparison
Immigrants from Cabo Verde
Immigrants from Lebanon
27.6%
FAMILY HOUSEHOLDS WITH CHILDREN
75.6/ 100
METRIC RATING
153rd/ 347
METRIC RANK
28.6%
FAMILY HOUSEHOLDS WITH CHILDREN
99.9/ 100
METRIC RATING
63rd/ 347
METRIC RANK
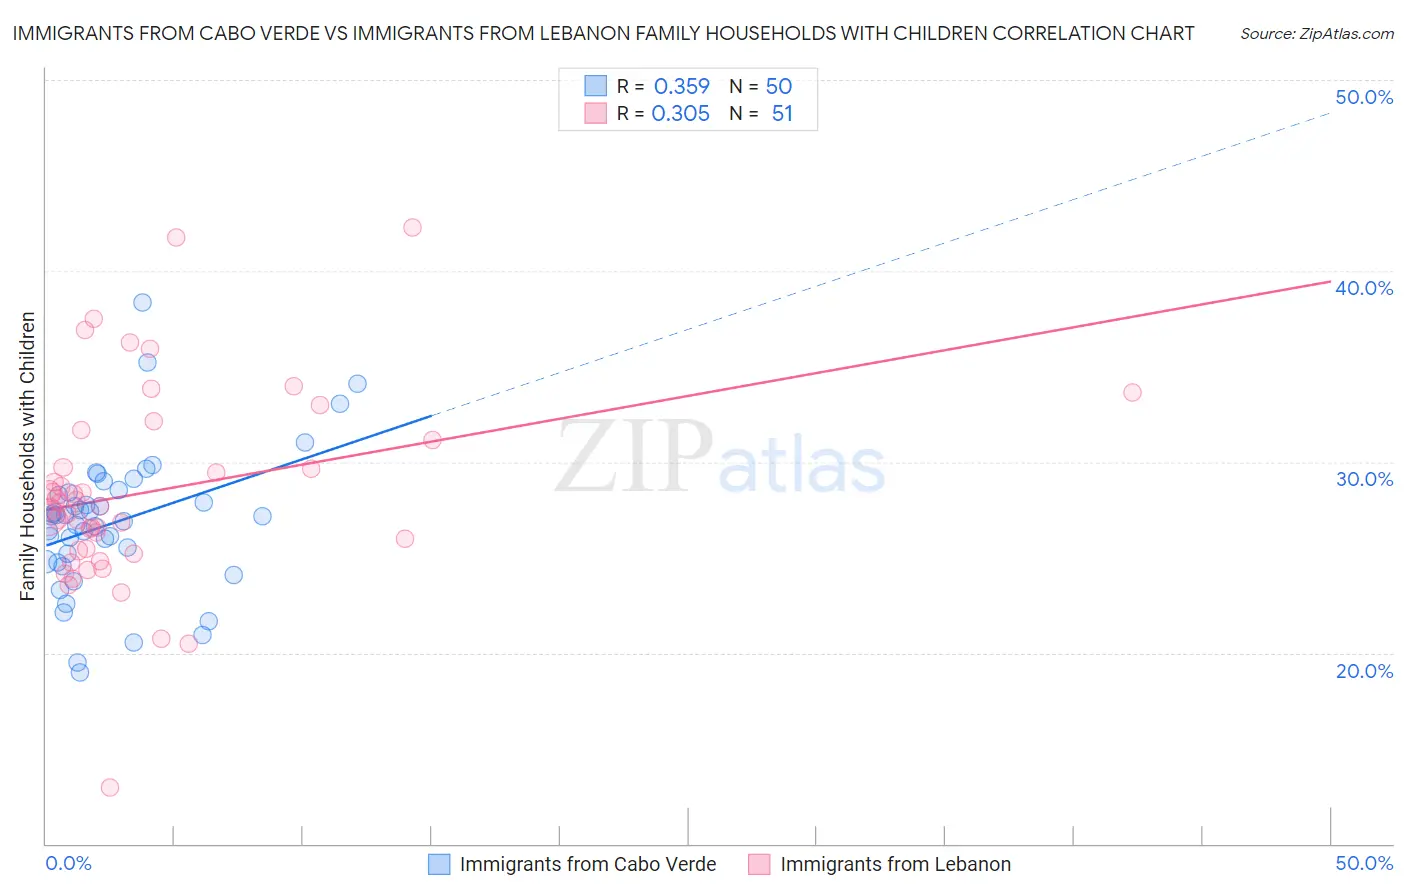
Immigrants from Cabo Verde vs Immigrants from Lebanon Family Households with Children Correlation Chart
The statistical analysis conducted on geographies consisting of 38,129,777 people shows a mild positive correlation between the proportion of Immigrants from Cabo Verde and percentage of family households with children in the United States with a correlation coefficient (R) of 0.359 and weighted average of 27.6%. Similarly, the statistical analysis conducted on geographies consisting of 217,098,842 people shows a mild positive correlation between the proportion of Immigrants from Lebanon and percentage of family households with children in the United States with a correlation coefficient (R) of 0.305 and weighted average of 28.6%, a difference of 3.4%.
Family Households with Children Correlation Summary
| Measurement | Immigrants from Cabo Verde | Immigrants from Lebanon |
| Minimum | 19.0% | 12.9% |
| Maximum | 38.4% | 42.3% |
| Range | 19.4% | 29.3% |
| Mean | 26.8% | 28.4% |
| Median | 27.1% | 27.7% |
| Interquartile 25% (IQ1) | 24.8% | 25.4% |
| Interquartile 75% (IQ3) | 28.4% | 31.2% |
| Interquartile Range (IQR) | 3.6% | 5.8% |
| Standard Deviation (Sample) | 3.7% | 5.2% |
| Standard Deviation (Population) | 3.7% | 5.2% |
Similar Demographics by Family Households with Children
Demographics Similar to Immigrants from Cabo Verde by Family Households with Children
In terms of family households with children, the demographic groups most similar to Immigrants from Cabo Verde are Icelander (27.6%, a difference of 0.010%), Comanche (27.6%, a difference of 0.020%), Hungarian (27.6%, a difference of 0.030%), Ethiopian (27.6%, a difference of 0.040%), and Portuguese (27.6%, a difference of 0.070%).
| Demographics | Rating | Rank | Family Households with Children |
| Basques | 79.5 /100 | #146 | Good 27.7% |
| Immigrants | Moldova | 79.1 /100 | #147 | Good 27.6% |
| Osage | 79.0 /100 | #148 | Good 27.6% |
| Menominee | 78.9 /100 | #149 | Good 27.6% |
| Argentineans | 78.5 /100 | #150 | Good 27.6% |
| Portuguese | 77.8 /100 | #151 | Good 27.6% |
| Ethiopians | 77.0 /100 | #152 | Good 27.6% |
| Immigrants | Cabo Verde | 75.6 /100 | #153 | Good 27.6% |
| Icelanders | 75.3 /100 | #154 | Good 27.6% |
| Comanche | 74.8 /100 | #155 | Good 27.6% |
| Hungarians | 74.6 /100 | #156 | Good 27.6% |
| Indians (Asian) | 71.6 /100 | #157 | Good 27.6% |
| Romanians | 70.8 /100 | #158 | Good 27.6% |
| Mongolians | 70.7 /100 | #159 | Good 27.6% |
| Sub-Saharan Africans | 67.5 /100 | #160 | Good 27.6% |
Demographics Similar to Immigrants from Lebanon by Family Households with Children
In terms of family households with children, the demographic groups most similar to Immigrants from Lebanon are Immigrants from Ghana (28.6%, a difference of 0.010%), Egyptian (28.6%, a difference of 0.010%), Filipino (28.6%, a difference of 0.070%), Hmong (28.6%, a difference of 0.090%), and Immigrants from Nigeria (28.6%, a difference of 0.14%).
| Demographics | Rating | Rank | Family Households with Children |
| Immigrants | Guatemala | 100.0 /100 | #56 | Exceptional 28.8% |
| Danes | 100.0 /100 | #57 | Exceptional 28.7% |
| Hawaiians | 100.0 /100 | #58 | Exceptional 28.7% |
| Immigrants | Nigeria | 100.0 /100 | #59 | Exceptional 28.6% |
| Hmong | 99.9 /100 | #60 | Exceptional 28.6% |
| Immigrants | Ghana | 99.9 /100 | #61 | Exceptional 28.6% |
| Egyptians | 99.9 /100 | #62 | Exceptional 28.6% |
| Immigrants | Lebanon | 99.9 /100 | #63 | Exceptional 28.6% |
| Filipinos | 99.9 /100 | #64 | Exceptional 28.6% |
| Hondurans | 99.9 /100 | #65 | Exceptional 28.5% |
| Immigrants | Egypt | 99.9 /100 | #66 | Exceptional 28.5% |
| Ghanaians | 99.9 /100 | #67 | Exceptional 28.5% |
| Houma | 99.9 /100 | #68 | Exceptional 28.5% |
| Immigrants | Korea | 99.9 /100 | #69 | Exceptional 28.5% |
| Immigrants | Honduras | 99.9 /100 | #70 | Exceptional 28.5% |