Immigrants from Venezuela vs Canadian Divorced or Separated
COMPARE
Immigrants from Venezuela
Canadian
Divorced or Separated
Divorced or Separated Comparison
Immigrants from Venezuela
Canadians
13.1%
DIVORCED OR SEPARATED
0.0/ 100
METRIC RATING
302nd/ 347
METRIC RANK
12.4%
DIVORCED OR SEPARATED
5.3/ 100
METRIC RATING
232nd/ 347
METRIC RANK
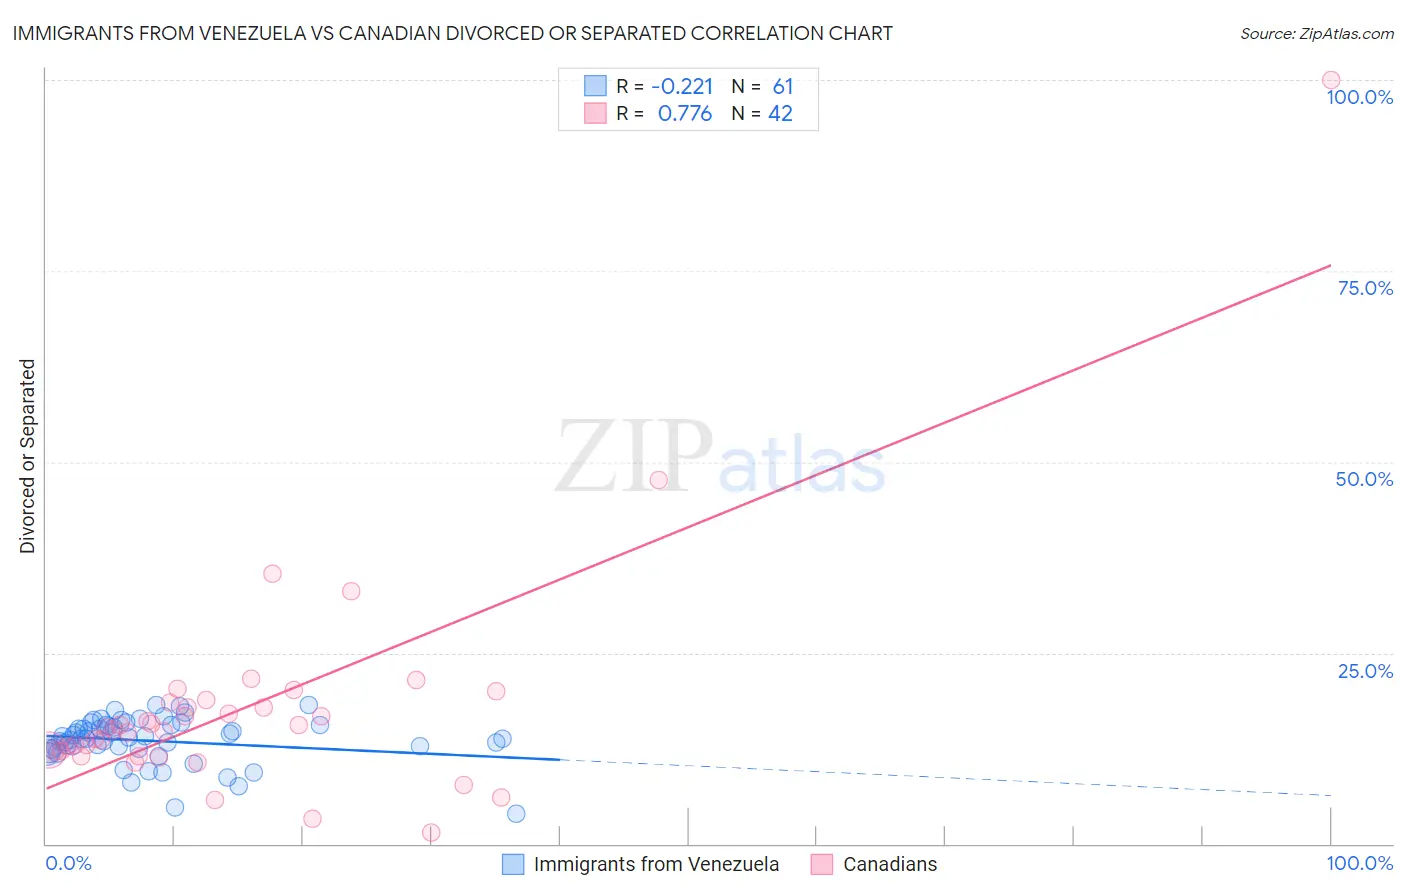
Immigrants from Venezuela vs Canadian Divorced or Separated Correlation Chart
The statistical analysis conducted on geographies consisting of 287,802,999 people shows a weak negative correlation between the proportion of Immigrants from Venezuela and percentage of population currently divorced or separated in the United States with a correlation coefficient (R) of -0.221 and weighted average of 13.1%. Similarly, the statistical analysis conducted on geographies consisting of 437,381,276 people shows a strong positive correlation between the proportion of Canadians and percentage of population currently divorced or separated in the United States with a correlation coefficient (R) of 0.776 and weighted average of 12.4%, a difference of 6.3%.
Divorced or Separated Correlation Summary
| Measurement | Immigrants from Venezuela | Canadian |
| Minimum | 4.0% | 1.4% |
| Maximum | 18.2% | 100.0% |
| Range | 14.2% | 98.6% |
| Mean | 13.5% | 17.8% |
| Median | 13.8% | 15.1% |
| Interquartile 25% (IQ1) | 12.4% | 12.1% |
| Interquartile 75% (IQ3) | 15.5% | 18.4% |
| Interquartile Range (IQR) | 3.1% | 6.3% |
| Standard Deviation (Sample) | 3.0% | 15.3% |
| Standard Deviation (Population) | 3.0% | 15.1% |
Similar Demographics by Divorced or Separated
Demographics Similar to Immigrants from Venezuela by Divorced or Separated
In terms of divorced or separated, the demographic groups most similar to Immigrants from Venezuela are Cape Verdean (13.1%, a difference of 0.020%), Alaskan Athabascan (13.1%, a difference of 0.10%), Hopi (13.2%, a difference of 0.15%), Chippewa (13.2%, a difference of 0.20%), and Immigrants from Cabo Verde (13.1%, a difference of 0.31%).
| Demographics | Rating | Rank | Divorced or Separated |
| Celtics | 0.0 /100 | #295 | Tragic 13.0% |
| Nicaraguans | 0.0 /100 | #296 | Tragic 13.0% |
| Natives/Alaskans | 0.0 /100 | #297 | Tragic 13.0% |
| Venezuelans | 0.0 /100 | #298 | Tragic 13.0% |
| Immigrants | Jamaica | 0.0 /100 | #299 | Tragic 13.0% |
| Immigrants | Cabo Verde | 0.0 /100 | #300 | Tragic 13.1% |
| Alaskan Athabascans | 0.0 /100 | #301 | Tragic 13.1% |
| Immigrants | Venezuela | 0.0 /100 | #302 | Tragic 13.1% |
| Cape Verdeans | 0.0 /100 | #303 | Tragic 13.1% |
| Hopi | 0.0 /100 | #304 | Tragic 13.2% |
| Chippewa | 0.0 /100 | #305 | Tragic 13.2% |
| Tlingit-Haida | 0.0 /100 | #306 | Tragic 13.2% |
| French American Indians | 0.0 /100 | #307 | Tragic 13.2% |
| Ottawa | 0.0 /100 | #308 | Tragic 13.2% |
| Americans | 0.0 /100 | #309 | Tragic 13.2% |
Demographics Similar to Canadians by Divorced or Separated
In terms of divorced or separated, the demographic groups most similar to Canadians are Malaysian (12.4%, a difference of 0.090%), West Indian (12.4%, a difference of 0.17%), Yugoslavian (12.3%, a difference of 0.19%), Immigrants from Bosnia and Herzegovina (12.4%, a difference of 0.19%), and Colombian (12.4%, a difference of 0.21%).
| Demographics | Rating | Rank | Divorced or Separated |
| Belgians | 9.7 /100 | #225 | Tragic 12.3% |
| Immigrants | Western Africa | 9.3 /100 | #226 | Tragic 12.3% |
| Hmong | 8.8 /100 | #227 | Tragic 12.3% |
| Immigrants | Cameroon | 8.3 /100 | #228 | Tragic 12.3% |
| Immigrants | Sudan | 8.2 /100 | #229 | Tragic 12.3% |
| Yakama | 7.8 /100 | #230 | Tragic 12.3% |
| Yugoslavians | 6.6 /100 | #231 | Tragic 12.3% |
| Canadians | 5.3 /100 | #232 | Tragic 12.4% |
| Malaysians | 4.8 /100 | #233 | Tragic 12.4% |
| West Indians | 4.4 /100 | #234 | Tragic 12.4% |
| Immigrants | Bosnia and Herzegovina | 4.3 /100 | #235 | Tragic 12.4% |
| Colombians | 4.2 /100 | #236 | Tragic 12.4% |
| Immigrants | Laos | 4.2 /100 | #237 | Tragic 12.4% |
| Sudanese | 4.0 /100 | #238 | Tragic 12.4% |
| Immigrants | Germany | 4.0 /100 | #239 | Tragic 12.4% |