Creek vs Immigrants from Mexico 10th Grade
COMPARE
Creek
Immigrants from Mexico
10th Grade
10th Grade Comparison
Creek
Immigrants from Mexico
94.2%
10TH GRADE
91.9/ 100
METRIC RATING
133rd/ 347
METRIC RANK
86.2%
10TH GRADE
0.0/ 100
METRIC RATING
347th/ 347
METRIC RANK
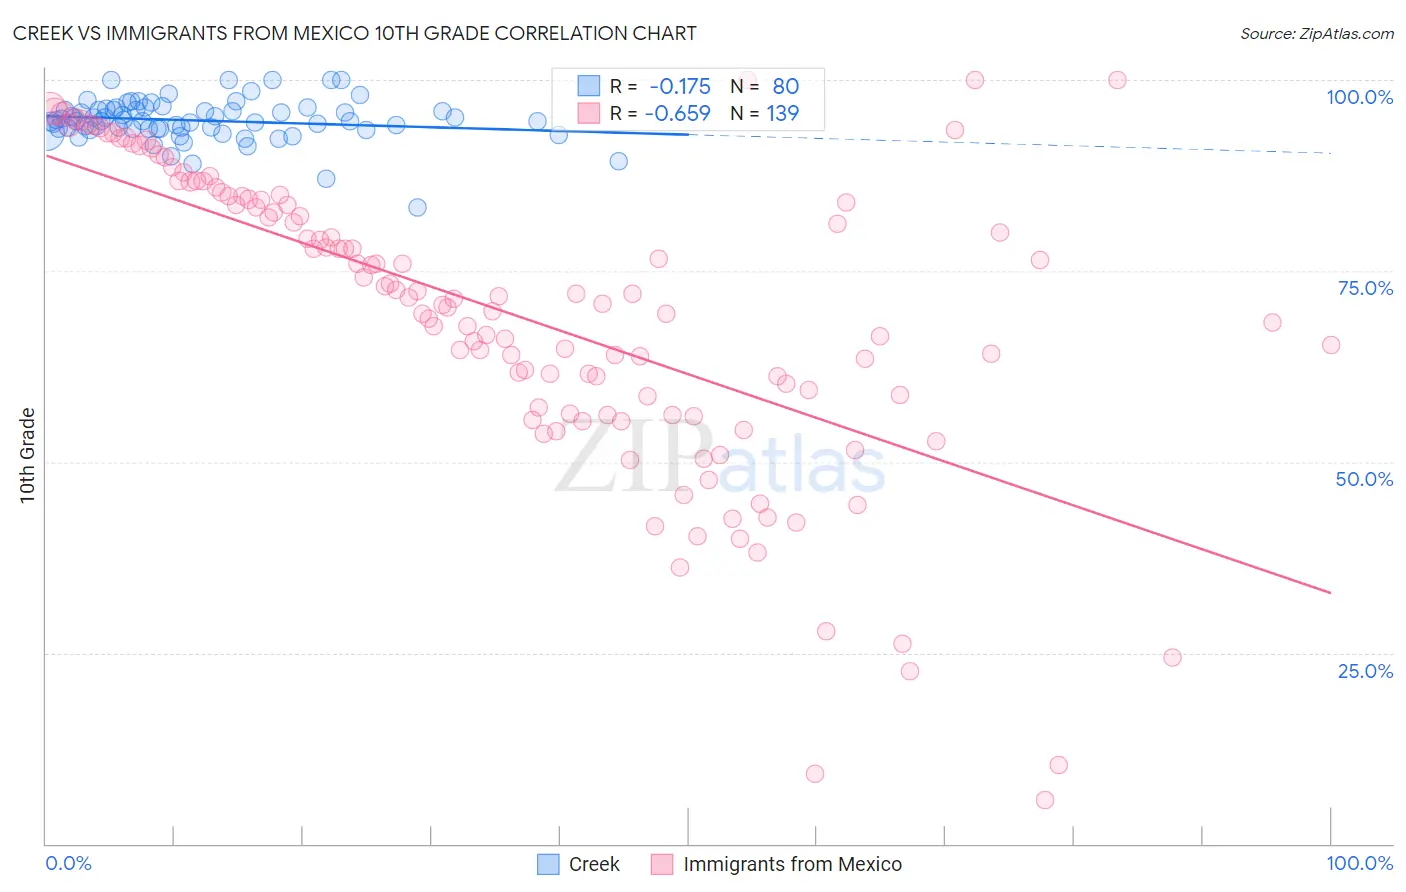
Creek vs Immigrants from Mexico 10th Grade Correlation Chart
The statistical analysis conducted on geographies consisting of 178,480,629 people shows a poor negative correlation between the proportion of Creek and percentage of population with at least 10th grade education in the United States with a correlation coefficient (R) of -0.175 and weighted average of 94.2%. Similarly, the statistical analysis conducted on geographies consisting of 513,766,684 people shows a significant negative correlation between the proportion of Immigrants from Mexico and percentage of population with at least 10th grade education in the United States with a correlation coefficient (R) of -0.659 and weighted average of 86.2%, a difference of 9.3%.
10th Grade Correlation Summary
| Measurement | Creek | Immigrants from Mexico |
| Minimum | 83.3% | 5.7% |
| Maximum | 100.0% | 100.0% |
| Range | 16.7% | 94.3% |
| Mean | 94.7% | 69.4% |
| Median | 94.6% | 71.5% |
| Interquartile 25% (IQ1) | 93.6% | 57.2% |
| Interquartile 75% (IQ3) | 96.1% | 84.8% |
| Interquartile Range (IQR) | 2.5% | 27.6% |
| Standard Deviation (Sample) | 2.7% | 19.7% |
| Standard Deviation (Population) | 2.7% | 19.7% |
Similar Demographics by 10th Grade
Demographics Similar to Creek by 10th Grade
In terms of 10th grade, the demographic groups most similar to Creek are Immigrants from Russia (94.3%, a difference of 0.010%), Osage (94.2%, a difference of 0.010%), Immigrants from Eastern Europe (94.3%, a difference of 0.020%), Immigrants from Korea (94.2%, a difference of 0.020%), and Iroquois (94.3%, a difference of 0.030%).
| Demographics | Rating | Rank | 10th Grade |
| Immigrants | Iran | 94.4 /100 | #126 | Exceptional 94.3% |
| Israelis | 93.8 /100 | #127 | Exceptional 94.3% |
| Potawatomi | 93.6 /100 | #128 | Exceptional 94.3% |
| Iroquois | 92.8 /100 | #129 | Exceptional 94.3% |
| Immigrants | Greece | 92.7 /100 | #130 | Exceptional 94.3% |
| Immigrants | Eastern Europe | 92.5 /100 | #131 | Exceptional 94.3% |
| Immigrants | Russia | 92.4 /100 | #132 | Exceptional 94.3% |
| Creek | 91.9 /100 | #133 | Exceptional 94.2% |
| Osage | 91.7 /100 | #134 | Exceptional 94.2% |
| Immigrants | Korea | 91.3 /100 | #135 | Exceptional 94.2% |
| Shoshone | 90.8 /100 | #136 | Exceptional 94.2% |
| Arapaho | 90.5 /100 | #137 | Exceptional 94.2% |
| Immigrants | Sri Lanka | 89.9 /100 | #138 | Excellent 94.2% |
| Immigrants | Bosnia and Herzegovina | 89.4 /100 | #139 | Excellent 94.2% |
| Immigrants | Jordan | 87.6 /100 | #140 | Excellent 94.1% |
Demographics Similar to Immigrants from Mexico by 10th Grade
In terms of 10th grade, the demographic groups most similar to Immigrants from Mexico are Spanish American Indian (86.2%, a difference of 0.010%), Immigrants from Central America (86.6%, a difference of 0.47%), Immigrants from El Salvador (86.8%, a difference of 0.65%), Yakama (86.9%, a difference of 0.78%), and Immigrants from Guatemala (87.4%, a difference of 1.4%).
| Demographics | Rating | Rank | 10th Grade |
| Hondurans | 0.0 /100 | #333 | Tragic 89.0% |
| Hispanics or Latinos | 0.0 /100 | #334 | Tragic 88.9% |
| Immigrants | Dominican Republic | 0.0 /100 | #335 | Tragic 88.7% |
| Immigrants | Honduras | 0.0 /100 | #336 | Tragic 88.5% |
| Central Americans | 0.0 /100 | #337 | Tragic 88.4% |
| Immigrants | Latin America | 0.0 /100 | #338 | Tragic 88.3% |
| Guatemalans | 0.0 /100 | #339 | Tragic 87.9% |
| Mexicans | 0.0 /100 | #340 | Tragic 87.8% |
| Salvadorans | 0.0 /100 | #341 | Tragic 87.5% |
| Immigrants | Guatemala | 0.0 /100 | #342 | Tragic 87.4% |
| Yakama | 0.0 /100 | #343 | Tragic 86.9% |
| Immigrants | El Salvador | 0.0 /100 | #344 | Tragic 86.8% |
| Immigrants | Central America | 0.0 /100 | #345 | Tragic 86.6% |
| Spanish American Indians | 0.0 /100 | #346 | Tragic 86.2% |
| Immigrants | Mexico | 0.0 /100 | #347 | Tragic 86.2% |