Immigrants from Belize vs Inupiat Family Households
COMPARE
Immigrants from Belize
Inupiat
Family Households
Family Households Comparison
Immigrants from Belize
Inupiat
64.9%
FAMILY HOUSEHOLDS
92.7/ 100
METRIC RATING
125th/ 347
METRIC RANK
67.8%
FAMILY HOUSEHOLDS
100.0/ 100
METRIC RATING
20th/ 347
METRIC RANK
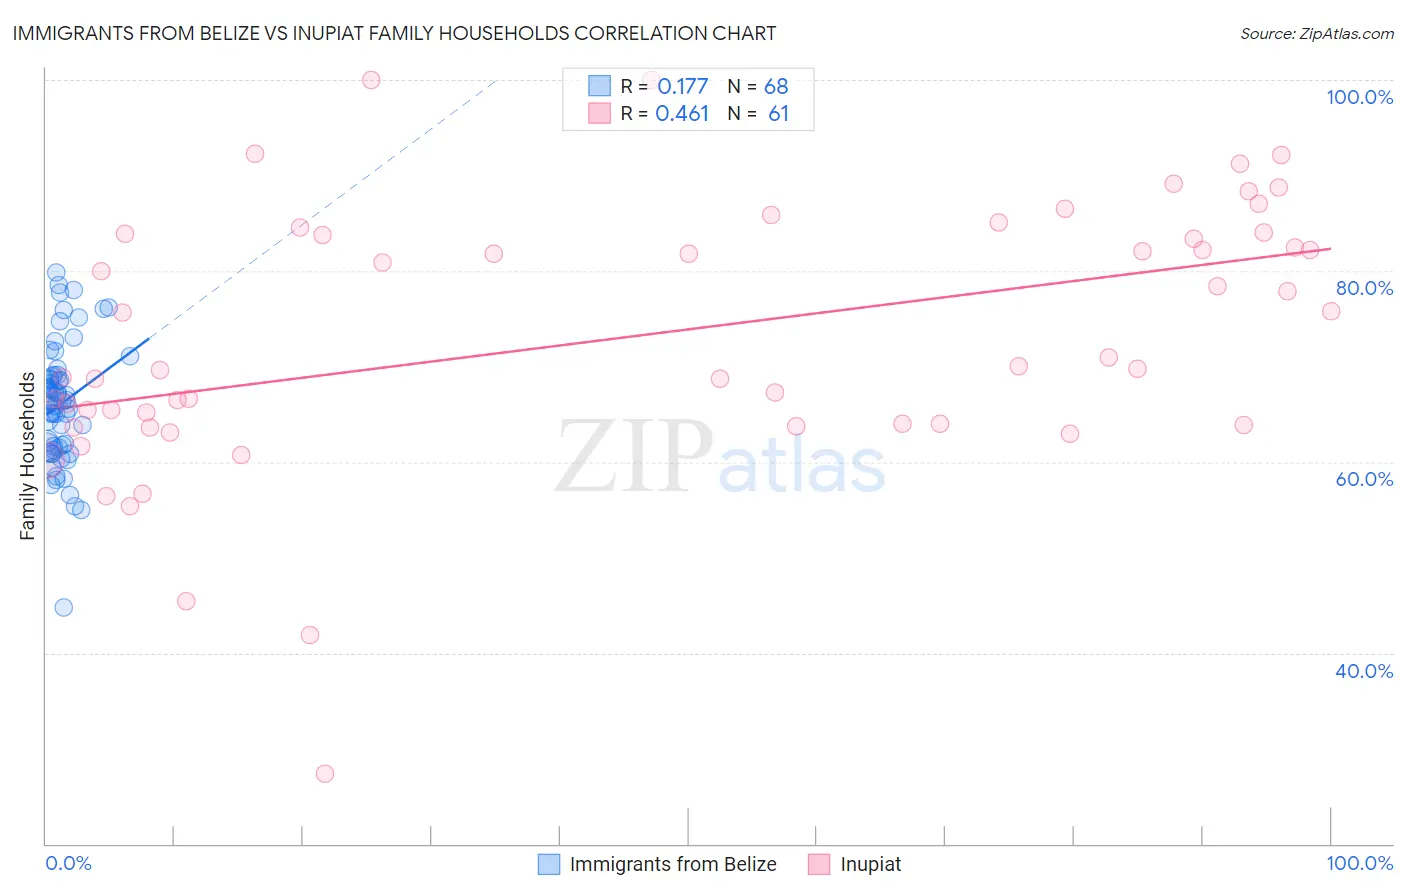
Immigrants from Belize vs Inupiat Family Households Correlation Chart
The statistical analysis conducted on geographies consisting of 130,284,292 people shows a poor positive correlation between the proportion of Immigrants from Belize and percentage of family households in the United States with a correlation coefficient (R) of 0.177 and weighted average of 64.9%. Similarly, the statistical analysis conducted on geographies consisting of 96,321,767 people shows a moderate positive correlation between the proportion of Inupiat and percentage of family households in the United States with a correlation coefficient (R) of 0.461 and weighted average of 67.8%, a difference of 4.5%.
Family Households Correlation Summary
| Measurement | Immigrants from Belize | Inupiat |
| Minimum | 44.8% | 27.3% |
| Maximum | 79.8% | 100.0% |
| Range | 35.1% | 72.7% |
| Mean | 66.0% | 73.1% |
| Median | 66.2% | 70.0% |
| Interquartile 25% (IQ1) | 61.5% | 63.9% |
| Interquartile 75% (IQ3) | 69.1% | 83.8% |
| Interquartile Range (IQR) | 7.5% | 19.9% |
| Standard Deviation (Sample) | 6.4% | 13.9% |
| Standard Deviation (Population) | 6.4% | 13.7% |
Similar Demographics by Family Households
Demographics Similar to Immigrants from Belize by Family Households
In terms of family households, the demographic groups most similar to Immigrants from Belize are Immigrants from Argentina (64.9%, a difference of 0.010%), Panamanian (64.8%, a difference of 0.020%), Hmong (64.9%, a difference of 0.030%), Choctaw (64.9%, a difference of 0.030%), and Immigrants from Panama (64.8%, a difference of 0.030%).
| Demographics | Rating | Rank | Family Households |
| Dutch | 95.1 /100 | #118 | Exceptional 64.9% |
| Immigrants | Eastern Asia | 94.4 /100 | #119 | Exceptional 64.9% |
| Immigrants | Oceania | 94.2 /100 | #120 | Exceptional 64.9% |
| Hungarians | 94.0 /100 | #121 | Exceptional 64.9% |
| Hmong | 93.4 /100 | #122 | Exceptional 64.9% |
| Choctaw | 93.4 /100 | #123 | Exceptional 64.9% |
| Immigrants | Argentina | 92.8 /100 | #124 | Exceptional 64.9% |
| Immigrants | Belize | 92.7 /100 | #125 | Exceptional 64.9% |
| Panamanians | 92.4 /100 | #126 | Exceptional 64.8% |
| Immigrants | Panama | 92.0 /100 | #127 | Exceptional 64.8% |
| Italians | 91.9 /100 | #128 | Exceptional 64.8% |
| Immigrants | Ecuador | 91.4 /100 | #129 | Exceptional 64.8% |
| Immigrants | Italy | 90.2 /100 | #130 | Exceptional 64.8% |
| Immigrants | Nonimmigrants | 90.1 /100 | #131 | Exceptional 64.8% |
| Cajuns | 89.4 /100 | #132 | Excellent 64.8% |
Demographics Similar to Inupiat by Family Households
In terms of family households, the demographic groups most similar to Inupiat are Cuban (67.7%, a difference of 0.050%), Sri Lankan (67.7%, a difference of 0.090%), Immigrants from Pakistan (67.7%, a difference of 0.17%), Samoan (67.9%, a difference of 0.25%), and Immigrants from Taiwan (68.0%, a difference of 0.37%).
| Demographics | Rating | Rank | Family Households |
| Pueblo | 100.0 /100 | #13 | Exceptional 68.2% |
| Immigrants | Cuba | 100.0 /100 | #14 | Exceptional 68.2% |
| Assyrians/Chaldeans/Syriacs | 100.0 /100 | #15 | Exceptional 68.2% |
| Immigrants | Vietnam | 100.0 /100 | #16 | Exceptional 68.2% |
| Chinese | 100.0 /100 | #17 | Exceptional 68.1% |
| Immigrants | Taiwan | 100.0 /100 | #18 | Exceptional 68.0% |
| Samoans | 100.0 /100 | #19 | Exceptional 67.9% |
| Inupiat | 100.0 /100 | #20 | Exceptional 67.8% |
| Cubans | 100.0 /100 | #21 | Exceptional 67.7% |
| Sri Lankans | 100.0 /100 | #22 | Exceptional 67.7% |
| Immigrants | Pakistan | 100.0 /100 | #23 | Exceptional 67.7% |
| Immigrants | South Eastern Asia | 100.0 /100 | #24 | Exceptional 67.5% |
| Immigrants | Nicaragua | 100.0 /100 | #25 | Exceptional 67.5% |
| Immigrants | India | 100.0 /100 | #26 | Exceptional 67.4% |
| Hispanics or Latinos | 100.0 /100 | #27 | Exceptional 67.4% |