Immigrants from Israel vs Ugandan Currently Married
COMPARE
Immigrants from Israel
Ugandan
Currently Married
Currently Married Comparison
Immigrants from Israel
Ugandans
48.1%
CURRENTLY MARRIED
96.9/ 100
METRIC RATING
84th/ 347
METRIC RANK
44.2%
CURRENTLY MARRIED
0.4/ 100
METRIC RATING
247th/ 347
METRIC RANK
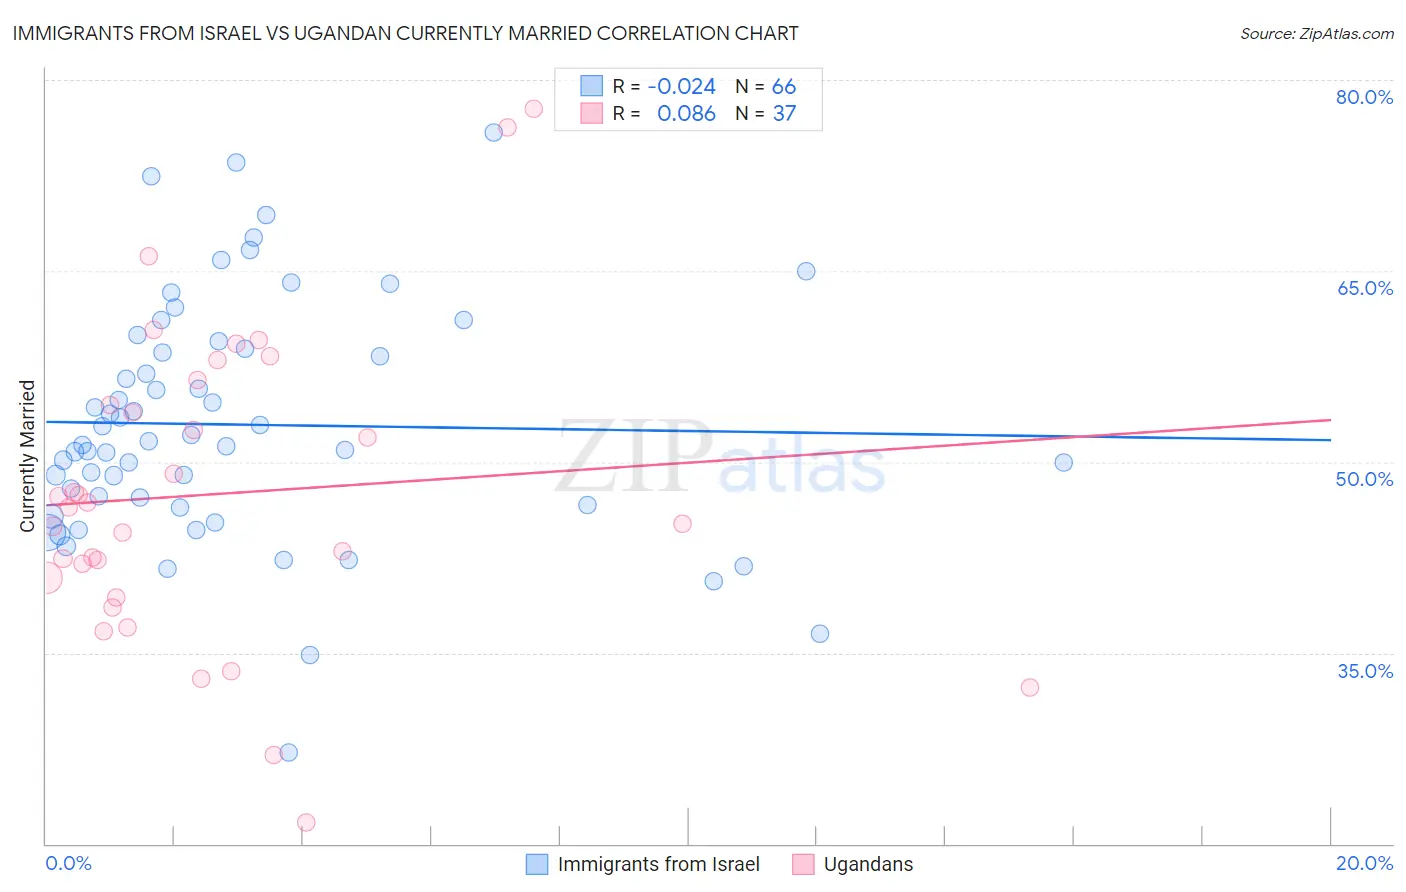
Immigrants from Israel vs Ugandan Currently Married Correlation Chart
The statistical analysis conducted on geographies consisting of 210,010,637 people shows no correlation between the proportion of Immigrants from Israel and percentage of population currently married in the United States with a correlation coefficient (R) of -0.024 and weighted average of 48.1%. Similarly, the statistical analysis conducted on geographies consisting of 94,016,399 people shows a slight positive correlation between the proportion of Ugandans and percentage of population currently married in the United States with a correlation coefficient (R) of 0.086 and weighted average of 44.2%, a difference of 8.7%.
Currently Married Correlation Summary
| Measurement | Immigrants from Israel | Ugandan |
| Minimum | 27.2% | 21.7% |
| Maximum | 75.9% | 77.7% |
| Range | 48.7% | 56.0% |
| Mean | 52.9% | 47.5% |
| Median | 51.5% | 46.4% |
| Interquartile 25% (IQ1) | 46.6% | 40.1% |
| Interquartile 75% (IQ3) | 58.9% | 55.4% |
| Interquartile Range (IQR) | 12.3% | 15.3% |
| Standard Deviation (Sample) | 9.4% | 12.1% |
| Standard Deviation (Population) | 9.4% | 11.9% |
Similar Demographics by Currently Married
Demographics Similar to Immigrants from Israel by Currently Married
In terms of currently married, the demographic groups most similar to Immigrants from Israel are Bolivian (48.1%, a difference of 0.0%), Immigrants from Sri Lanka (48.1%, a difference of 0.010%), Immigrants from Europe (48.1%, a difference of 0.010%), Immigrants from Poland (48.1%, a difference of 0.020%), and Immigrants from South Africa (48.1%, a difference of 0.050%).
| Demographics | Rating | Rank | Currently Married |
| Slovenes | 97.1 /100 | #77 | Exceptional 48.1% |
| Immigrants | Belgium | 97.1 /100 | #78 | Exceptional 48.1% |
| Immigrants | South Africa | 97.0 /100 | #79 | Exceptional 48.1% |
| Immigrants | Poland | 96.9 /100 | #80 | Exceptional 48.1% |
| Immigrants | Sri Lanka | 96.9 /100 | #81 | Exceptional 48.1% |
| Immigrants | Europe | 96.9 /100 | #82 | Exceptional 48.1% |
| Bolivians | 96.9 /100 | #83 | Exceptional 48.1% |
| Immigrants | Israel | 96.9 /100 | #84 | Exceptional 48.1% |
| French Canadians | 96.3 /100 | #85 | Exceptional 48.0% |
| Immigrants | Japan | 96.2 /100 | #86 | Exceptional 48.0% |
| Jordanians | 96.2 /100 | #87 | Exceptional 48.0% |
| Immigrants | Eastern Europe | 96.1 /100 | #88 | Exceptional 48.0% |
| Indians (Asian) | 95.8 /100 | #89 | Exceptional 48.0% |
| Americans | 95.7 /100 | #90 | Exceptional 48.0% |
| Immigrants | Bolivia | 95.6 /100 | #91 | Exceptional 47.9% |
Demographics Similar to Ugandans by Currently Married
In terms of currently married, the demographic groups most similar to Ugandans are Nicaraguan (44.2%, a difference of 0.090%), Immigrants from Cameroon (44.2%, a difference of 0.10%), Immigrants from Eastern Africa (44.2%, a difference of 0.12%), Immigrants from Burma/Myanmar (44.3%, a difference of 0.13%), and Blackfeet (44.2%, a difference of 0.19%).
| Demographics | Rating | Rank | Currently Married |
| Mexican American Indians | 0.7 /100 | #240 | Tragic 44.5% |
| Ethiopians | 0.7 /100 | #241 | Tragic 44.5% |
| Immigrants | Cambodia | 0.7 /100 | #242 | Tragic 44.5% |
| Immigrants | Ethiopia | 0.7 /100 | #243 | Tragic 44.5% |
| Japanese | 0.6 /100 | #244 | Tragic 44.5% |
| Immigrants | Armenia | 0.4 /100 | #245 | Tragic 44.3% |
| Immigrants | Burma/Myanmar | 0.4 /100 | #246 | Tragic 44.3% |
| Ugandans | 0.4 /100 | #247 | Tragic 44.2% |
| Nicaraguans | 0.3 /100 | #248 | Tragic 44.2% |
| Immigrants | Cameroon | 0.3 /100 | #249 | Tragic 44.2% |
| Immigrants | Eastern Africa | 0.3 /100 | #250 | Tragic 44.2% |
| Blackfeet | 0.3 /100 | #251 | Tragic 44.2% |
| Hispanics or Latinos | 0.3 /100 | #252 | Tragic 44.1% |
| Immigrants | Central America | 0.3 /100 | #253 | Tragic 44.1% |
| Vietnamese | 0.2 /100 | #254 | Tragic 44.0% |