Chilean vs Kenyan Currently Married
COMPARE
Chilean
Kenyan
Currently Married
Currently Married Comparison
Chileans
Kenyans
47.0%
CURRENTLY MARRIED
69.8/ 100
METRIC RATING
151st/ 347
METRIC RANK
45.2%
CURRENTLY MARRIED
3.1/ 100
METRIC RATING
220th/ 347
METRIC RANK
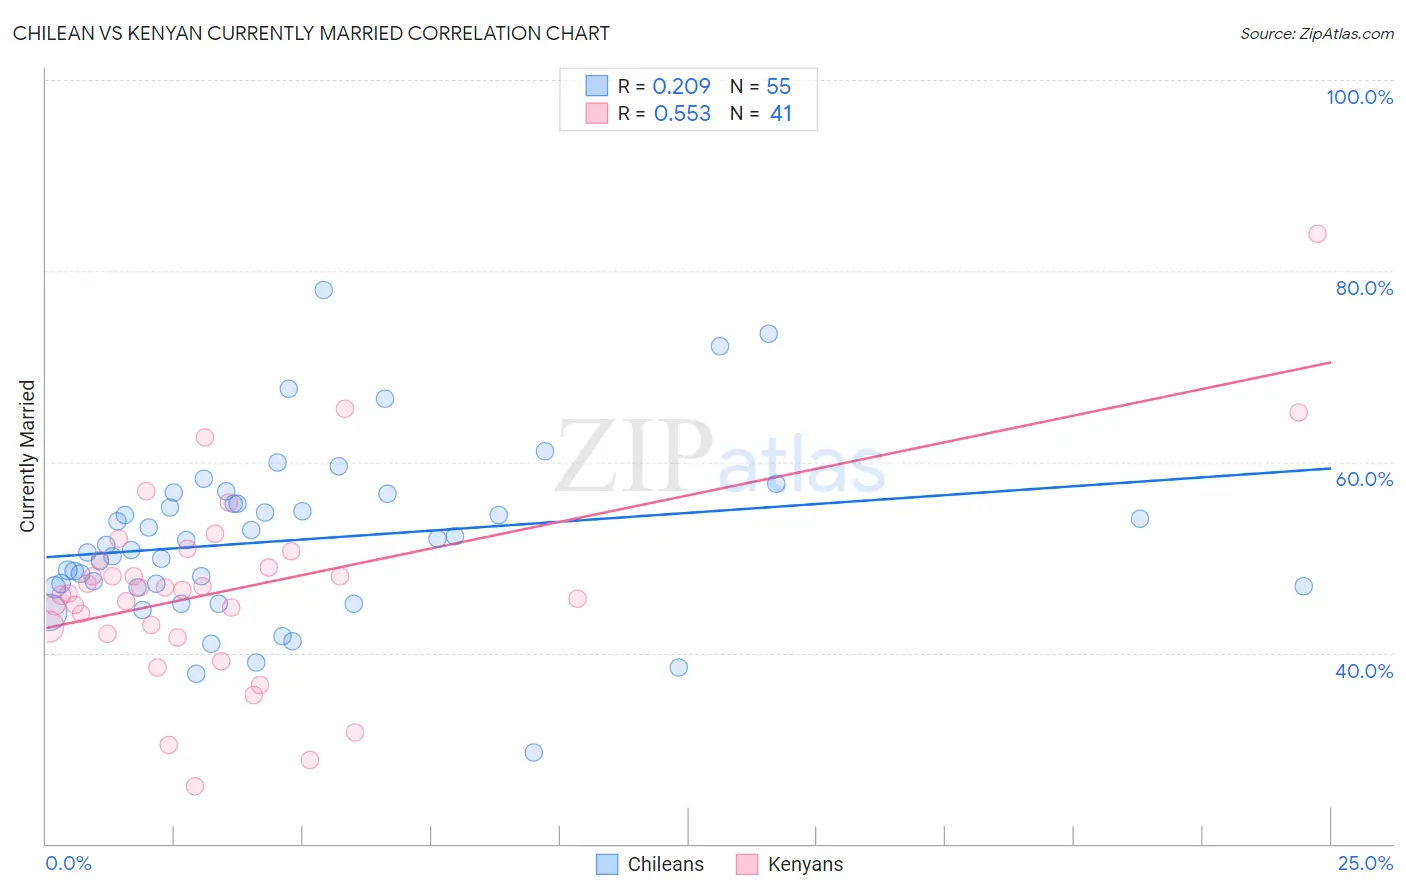
Chilean vs Kenyan Currently Married Correlation Chart
The statistical analysis conducted on geographies consisting of 256,662,716 people shows a weak positive correlation between the proportion of Chileans and percentage of population currently married in the United States with a correlation coefficient (R) of 0.209 and weighted average of 47.0%. Similarly, the statistical analysis conducted on geographies consisting of 168,238,911 people shows a substantial positive correlation between the proportion of Kenyans and percentage of population currently married in the United States with a correlation coefficient (R) of 0.553 and weighted average of 45.2%, a difference of 4.0%.
Currently Married Correlation Summary
| Measurement | Chilean | Kenyan |
| Minimum | 29.6% | 26.0% |
| Maximum | 78.0% | 83.9% |
| Range | 48.4% | 57.9% |
| Mean | 51.8% | 46.8% |
| Median | 51.2% | 46.5% |
| Interquartile 25% (IQ1) | 46.9% | 42.3% |
| Interquartile 75% (IQ3) | 55.6% | 50.1% |
| Interquartile Range (IQR) | 8.7% | 7.8% |
| Standard Deviation (Sample) | 8.9% | 10.4% |
| Standard Deviation (Population) | 8.8% | 10.3% |
Similar Demographics by Currently Married
Demographics Similar to Chileans by Currently Married
In terms of currently married, the demographic groups most similar to Chileans are Zimbabwean (47.0%, a difference of 0.010%), Immigrants from Turkey (47.0%, a difference of 0.010%), Cambodian (47.0%, a difference of 0.030%), Immigrants from Serbia (47.0%, a difference of 0.040%), and Immigrants from Venezuela (47.0%, a difference of 0.050%).
| Demographics | Rating | Rank | Currently Married |
| Hmong | 73.4 /100 | #144 | Good 47.1% |
| Immigrants | South Eastern Asia | 72.9 /100 | #145 | Good 47.1% |
| Carpatho Rusyns | 72.6 /100 | #146 | Good 47.0% |
| Immigrants | Argentina | 72.0 /100 | #147 | Good 47.0% |
| Cambodians | 70.4 /100 | #148 | Good 47.0% |
| Zimbabweans | 70.1 /100 | #149 | Good 47.0% |
| Immigrants | Turkey | 70.0 /100 | #150 | Good 47.0% |
| Chileans | 69.8 /100 | #151 | Good 47.0% |
| Immigrants | Serbia | 68.8 /100 | #152 | Good 47.0% |
| Immigrants | Venezuela | 68.6 /100 | #153 | Good 47.0% |
| Albanians | 68.6 /100 | #154 | Good 47.0% |
| Arabs | 68.6 /100 | #155 | Good 47.0% |
| Spanish | 68.1 /100 | #156 | Good 47.0% |
| Immigrants | Switzerland | 67.8 /100 | #157 | Good 46.9% |
| Cherokee | 66.8 /100 | #158 | Good 46.9% |
Demographics Similar to Kenyans by Currently Married
In terms of currently married, the demographic groups most similar to Kenyans are Mexican (45.2%, a difference of 0.020%), Immigrants from Portugal (45.2%, a difference of 0.13%), Immigrants from the Azores (45.1%, a difference of 0.22%), Panamanian (45.3%, a difference of 0.24%), and Immigrants from Laos (45.0%, a difference of 0.30%).
| Demographics | Rating | Rank | Currently Married |
| Alaska Natives | 7.0 /100 | #213 | Tragic 45.5% |
| Dutch West Indians | 6.7 /100 | #214 | Tragic 45.5% |
| German Russians | 6.7 /100 | #215 | Tragic 45.5% |
| Immigrants | Morocco | 5.5 /100 | #216 | Tragic 45.4% |
| Immigrants | Thailand | 5.1 /100 | #217 | Tragic 45.4% |
| Panamanians | 4.0 /100 | #218 | Tragic 45.3% |
| Immigrants | Portugal | 3.5 /100 | #219 | Tragic 45.2% |
| Kenyans | 3.1 /100 | #220 | Tragic 45.2% |
| Mexicans | 3.0 /100 | #221 | Tragic 45.2% |
| Immigrants | Azores | 2.5 /100 | #222 | Tragic 45.1% |
| Immigrants | Laos | 2.3 /100 | #223 | Tragic 45.0% |
| Immigrants | Uganda | 2.2 /100 | #224 | Tragic 45.0% |
| French American Indians | 2.2 /100 | #225 | Tragic 45.0% |
| Comanche | 2.1 /100 | #226 | Tragic 45.0% |
| Spanish Americans | 2.1 /100 | #227 | Tragic 45.0% |