Cheyenne vs Chilean Births to Unmarried Women
COMPARE
Cheyenne
Chilean
Births to Unmarried Women
Births to Unmarried Women Comparison
Cheyenne
Chileans
41.3%
BIRTHS TO UNMARRIED WOMEN
0.0/ 100
METRIC RATING
325th/ 347
METRIC RANK
30.7%
BIRTHS TO UNMARRIED WOMEN
79.1/ 100
METRIC RATING
148th/ 347
METRIC RANK
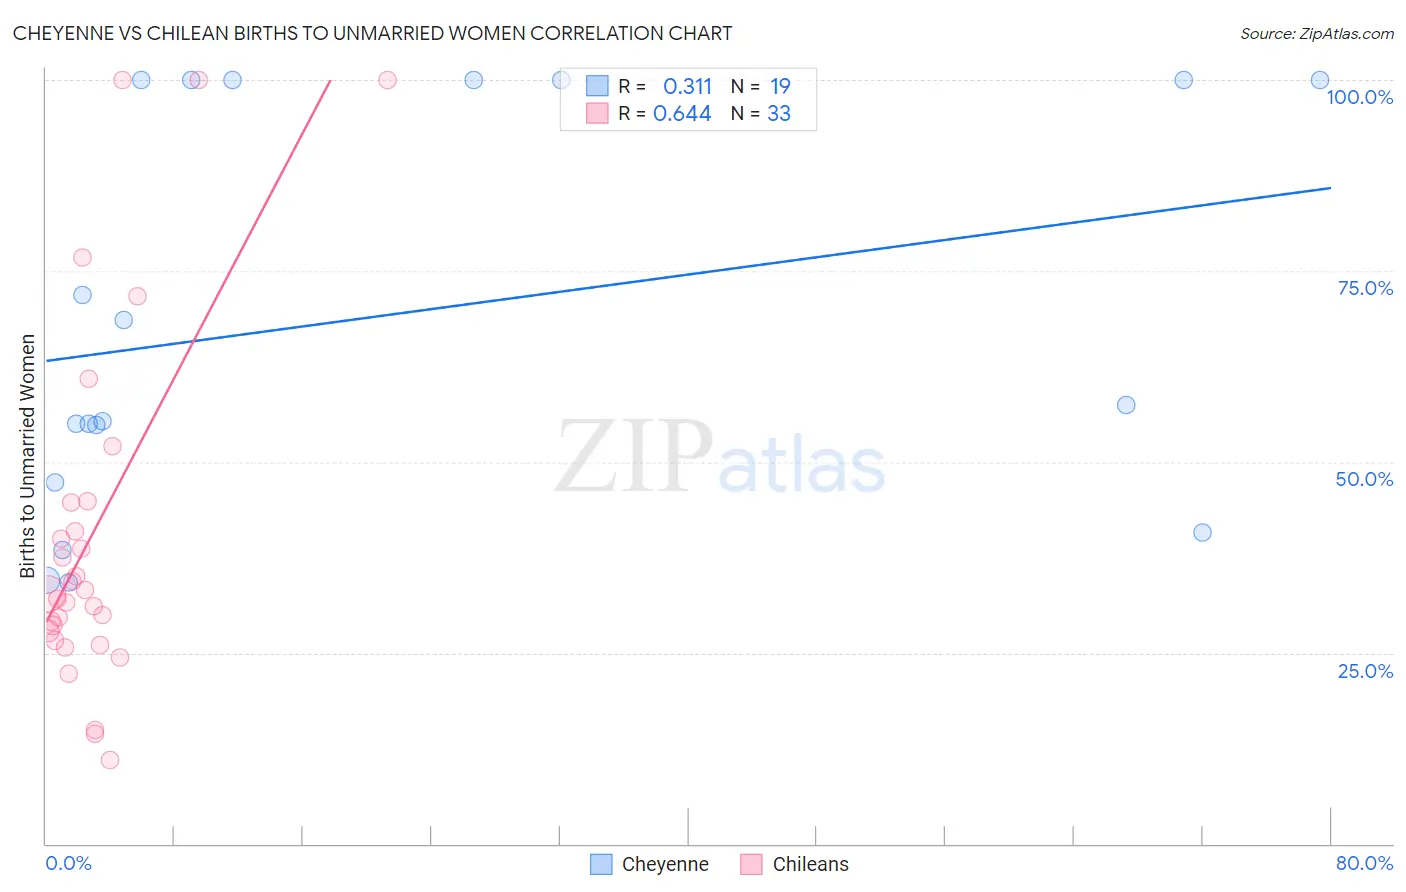
Cheyenne vs Chilean Births to Unmarried Women Correlation Chart
The statistical analysis conducted on geographies consisting of 79,528,425 people shows a mild positive correlation between the proportion of Cheyenne and percentage of births to unmarried women in the United States with a correlation coefficient (R) of 0.311 and weighted average of 41.3%. Similarly, the statistical analysis conducted on geographies consisting of 245,289,700 people shows a significant positive correlation between the proportion of Chileans and percentage of births to unmarried women in the United States with a correlation coefficient (R) of 0.644 and weighted average of 30.7%, a difference of 34.8%.
Births to Unmarried Women Correlation Summary
| Measurement | Cheyenne | Chilean |
| Minimum | 34.1% | 10.9% |
| Maximum | 100.0% | 100.0% |
| Range | 65.9% | 89.1% |
| Mean | 69.1% | 40.9% |
| Median | 57.4% | 32.7% |
| Interquartile 25% (IQ1) | 47.3% | 27.2% |
| Interquartile 75% (IQ3) | 100.0% | 44.8% |
| Interquartile Range (IQR) | 52.7% | 17.5% |
| Standard Deviation (Sample) | 26.1% | 23.7% |
| Standard Deviation (Population) | 25.4% | 23.4% |
Similar Demographics by Births to Unmarried Women
Demographics Similar to Cheyenne by Births to Unmarried Women
In terms of births to unmarried women, the demographic groups most similar to Cheyenne are Cape Verdean (41.3%, a difference of 0.060%), Immigrants from Cuba (41.5%, a difference of 0.27%), Sioux (41.0%, a difference of 0.85%), Cajun (41.0%, a difference of 0.93%), and Bahamian (40.8%, a difference of 1.4%).
| Demographics | Rating | Rank | Births to Unmarried Women |
| Immigrants | Bahamas | 0.0 /100 | #318 | Tragic 40.1% |
| Yakama | 0.0 /100 | #319 | Tragic 40.3% |
| Crow | 0.0 /100 | #320 | Tragic 40.4% |
| Bahamians | 0.0 /100 | #321 | Tragic 40.8% |
| Cajuns | 0.0 /100 | #322 | Tragic 41.0% |
| Sioux | 0.0 /100 | #323 | Tragic 41.0% |
| Cape Verdeans | 0.0 /100 | #324 | Tragic 41.3% |
| Cheyenne | 0.0 /100 | #325 | Tragic 41.3% |
| Immigrants | Cuba | 0.0 /100 | #326 | Tragic 41.5% |
| Tsimshian | 0.0 /100 | #327 | Tragic 42.2% |
| Immigrants | Cabo Verde | 0.0 /100 | #328 | Tragic 42.2% |
| Paiute | 0.0 /100 | #329 | Tragic 42.5% |
| Chippewa | 0.0 /100 | #330 | Tragic 42.6% |
| Natives/Alaskans | 0.0 /100 | #331 | Tragic 43.0% |
| Kiowa | 0.0 /100 | #332 | Tragic 43.1% |
Demographics Similar to Chileans by Births to Unmarried Women
In terms of births to unmarried women, the demographic groups most similar to Chileans are Serbian (30.7%, a difference of 0.040%), Somali (30.7%, a difference of 0.19%), Italian (30.8%, a difference of 0.30%), Immigrants from Oceania (30.6%, a difference of 0.33%), and Northern European (30.6%, a difference of 0.36%).
| Demographics | Rating | Rank | Births to Unmarried Women |
| Pakistanis | 83.0 /100 | #141 | Excellent 30.5% |
| South Africans | 82.7 /100 | #142 | Excellent 30.5% |
| Immigrants | Uganda | 82.6 /100 | #143 | Excellent 30.5% |
| Czechs | 82.1 /100 | #144 | Excellent 30.5% |
| Immigrants | North America | 81.5 /100 | #145 | Excellent 30.6% |
| Northern Europeans | 81.4 /100 | #146 | Excellent 30.6% |
| Immigrants | Oceania | 81.2 /100 | #147 | Excellent 30.6% |
| Chileans | 79.1 /100 | #148 | Good 30.7% |
| Serbians | 78.8 /100 | #149 | Good 30.7% |
| Somalis | 77.8 /100 | #150 | Good 30.7% |
| Italians | 77.0 /100 | #151 | Good 30.8% |
| Poles | 76.2 /100 | #152 | Good 30.8% |
| British | 76.0 /100 | #153 | Good 30.8% |
| Yugoslavians | 75.1 /100 | #154 | Good 30.8% |
| Immigrants | Bangladesh | 73.9 /100 | #155 | Good 30.9% |