Afghan vs Chilean Births to Unmarried Women
COMPARE
Afghan
Chilean
Births to Unmarried Women
Births to Unmarried Women Comparison
Afghans
Chileans
27.9%
BIRTHS TO UNMARRIED WOMEN
99.4/ 100
METRIC RATING
54th/ 347
METRIC RANK
30.7%
BIRTHS TO UNMARRIED WOMEN
79.1/ 100
METRIC RATING
148th/ 347
METRIC RANK
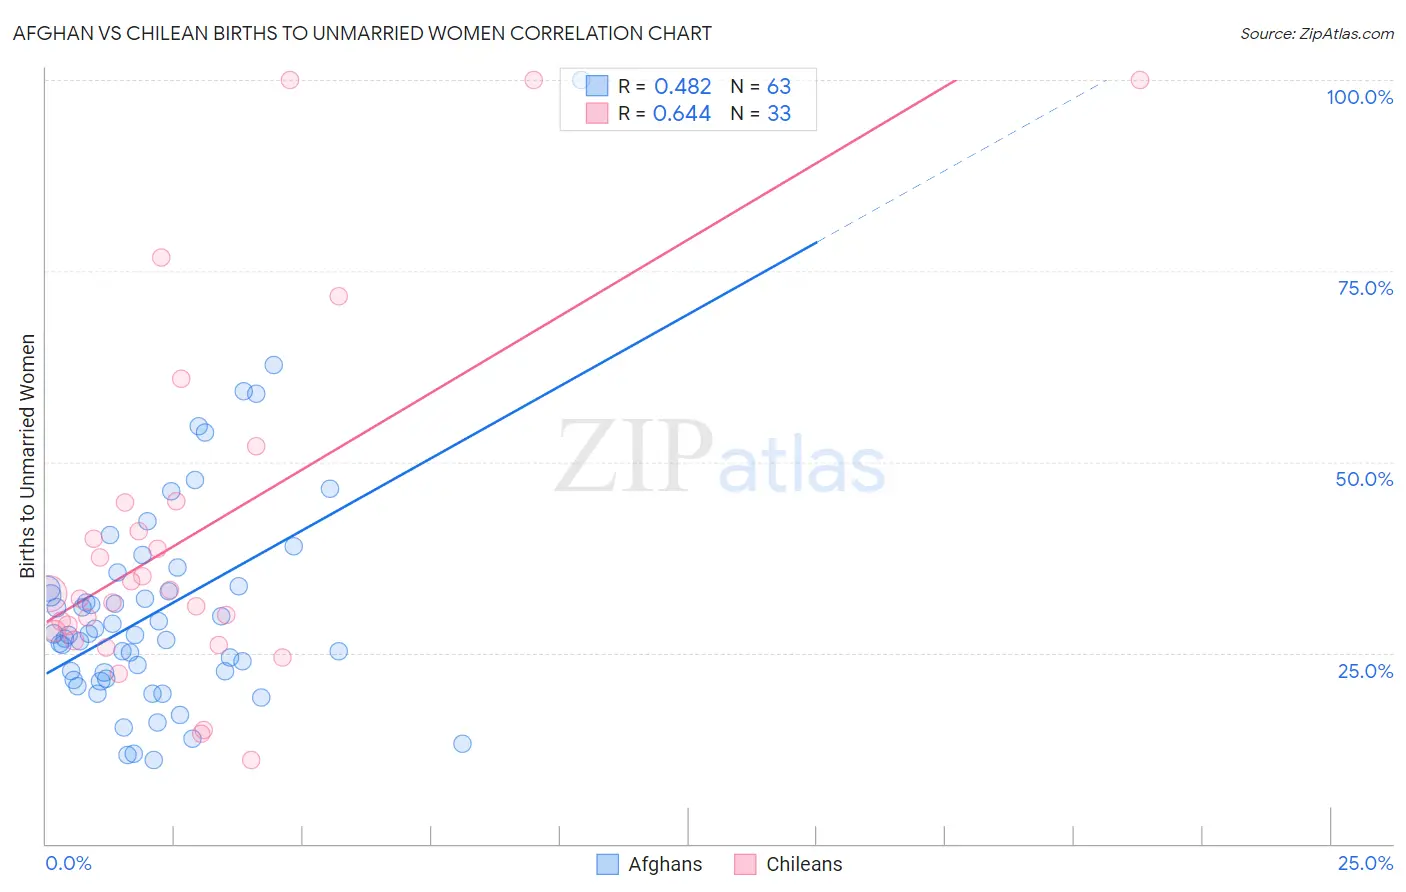
Afghan vs Chilean Births to Unmarried Women Correlation Chart
The statistical analysis conducted on geographies consisting of 144,906,952 people shows a moderate positive correlation between the proportion of Afghans and percentage of births to unmarried women in the United States with a correlation coefficient (R) of 0.482 and weighted average of 27.9%. Similarly, the statistical analysis conducted on geographies consisting of 245,289,700 people shows a significant positive correlation between the proportion of Chileans and percentage of births to unmarried women in the United States with a correlation coefficient (R) of 0.644 and weighted average of 30.7%, a difference of 10.0%.
Births to Unmarried Women Correlation Summary
| Measurement | Afghan | Chilean |
| Minimum | 11.0% | 10.9% |
| Maximum | 100.0% | 100.0% |
| Range | 89.0% | 89.1% |
| Mean | 30.6% | 40.9% |
| Median | 27.4% | 32.7% |
| Interquartile 25% (IQ1) | 21.6% | 27.2% |
| Interquartile 75% (IQ3) | 33.7% | 44.8% |
| Interquartile Range (IQR) | 12.1% | 17.5% |
| Standard Deviation (Sample) | 14.8% | 23.7% |
| Standard Deviation (Population) | 14.7% | 23.4% |
Similar Demographics by Births to Unmarried Women
Demographics Similar to Afghans by Births to Unmarried Women
In terms of births to unmarried women, the demographic groups most similar to Afghans are Mongolian (27.9%, a difference of 0.040%), Immigrants from Romania (27.9%, a difference of 0.070%), Bhutanese (27.9%, a difference of 0.090%), Macedonian (27.9%, a difference of 0.12%), and Maltese (27.8%, a difference of 0.25%).
| Demographics | Rating | Rank | Births to Unmarried Women |
| Hmong | 99.5 /100 | #47 | Exceptional 27.7% |
| Eastern Europeans | 99.5 /100 | #48 | Exceptional 27.7% |
| Immigrants | Greece | 99.4 /100 | #49 | Exceptional 27.8% |
| Maltese | 99.4 /100 | #50 | Exceptional 27.8% |
| Macedonians | 99.4 /100 | #51 | Exceptional 27.9% |
| Bhutanese | 99.4 /100 | #52 | Exceptional 27.9% |
| Immigrants | Romania | 99.4 /100 | #53 | Exceptional 27.9% |
| Afghans | 99.4 /100 | #54 | Exceptional 27.9% |
| Mongolians | 99.3 /100 | #55 | Exceptional 27.9% |
| Immigrants | Belgium | 99.3 /100 | #56 | Exceptional 28.0% |
| Russians | 99.2 /100 | #57 | Exceptional 28.0% |
| Immigrants | Albania | 99.2 /100 | #58 | Exceptional 28.0% |
| Immigrants | Kazakhstan | 99.1 /100 | #59 | Exceptional 28.1% |
| Immigrants | Turkey | 99.1 /100 | #60 | Exceptional 28.1% |
| Immigrants | North Macedonia | 99.1 /100 | #61 | Exceptional 28.1% |
Demographics Similar to Chileans by Births to Unmarried Women
In terms of births to unmarried women, the demographic groups most similar to Chileans are Serbian (30.7%, a difference of 0.040%), Somali (30.7%, a difference of 0.19%), Italian (30.8%, a difference of 0.30%), Immigrants from Oceania (30.6%, a difference of 0.33%), and Northern European (30.6%, a difference of 0.36%).
| Demographics | Rating | Rank | Births to Unmarried Women |
| Pakistanis | 83.0 /100 | #141 | Excellent 30.5% |
| South Africans | 82.7 /100 | #142 | Excellent 30.5% |
| Immigrants | Uganda | 82.6 /100 | #143 | Excellent 30.5% |
| Czechs | 82.1 /100 | #144 | Excellent 30.5% |
| Immigrants | North America | 81.5 /100 | #145 | Excellent 30.6% |
| Northern Europeans | 81.4 /100 | #146 | Excellent 30.6% |
| Immigrants | Oceania | 81.2 /100 | #147 | Excellent 30.6% |
| Chileans | 79.1 /100 | #148 | Good 30.7% |
| Serbians | 78.8 /100 | #149 | Good 30.7% |
| Somalis | 77.8 /100 | #150 | Good 30.7% |
| Italians | 77.0 /100 | #151 | Good 30.8% |
| Poles | 76.2 /100 | #152 | Good 30.8% |
| British | 76.0 /100 | #153 | Good 30.8% |
| Yugoslavians | 75.1 /100 | #154 | Good 30.8% |
| Immigrants | Bangladesh | 73.9 /100 | #155 | Good 30.9% |